


The Jordan, Knauff & Company (JKC) Valve Stock Index was up 3.5 percent over the last twelve months, while the broader S&P 500 Index was up 20.8 percent. The JKC Pump Stock Index increased 3.9 percent for the same time period. (The S&P Return figures are provided by Capital IQ.)
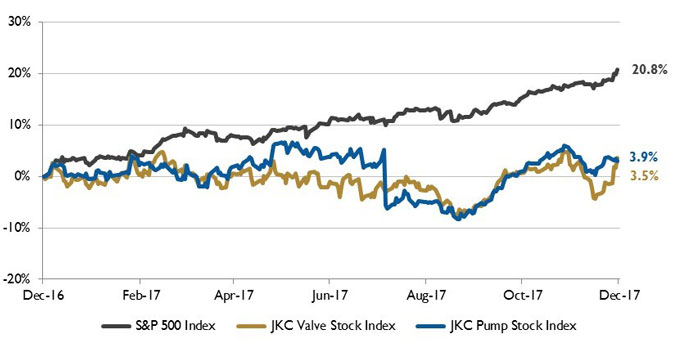 Figure 1. Stock Indices from December 1, 2016 to November 30, 2017. Local currency converted to USD using historical spot rates. The JKC Pump and Valve Stock Indices include a select list of publicly traded companies involved in the pump and valve industries, weighted by market capitalization. Source: Capital IQ and JKC research.
 The Institute for Supply Management’s Purchasing Managers’ Index (PMI) fell slightly in November to 58.2 percent from 58.7 percent in October. The Production Index had it highest reading since March 2011, growing 2.9 percent for the month to 63.9 percent. The Production Index has been above 60 percent since June. The New Orders Index grew to 64.0 percent, above the October reading and the 62.7 percent six-month average. The Employment Index fell slightly to 59.7 percent, but is still above its six-month average of 58.7 percent. Industries reporting employment gains include textile mills, machinery, computer products and paper.
The price of Brent crude oil closed at its highest level in more than two years in late October, settling at more than $60 per barrel for the first time since July 2015. The U.S. Energy Information Administration (EIA) forecasts Brent prices to ease in the coming months and average $53 per barrel in 2017 and $56 per barrel in 2018. Global economic data remain robust and support rising oil demand. The EIA expects the growth of the global oil supply to outpace the growth in global oil demand in 2018, contributing to global oil inventories rising by 0.3 million barrels per day in 2018, compared with a 0.2 million barrels per day draw in 2017.
The Organization of Petroleum Exporting Countries (OPEC), and some non-OPEC producers including Russia, agreed to extend oil output reductions until the end of 2018. The current agreement expires in March of next year. The 21 nations participating in the agreement are collectively trying to reduce output by 1.8 million barrels a day (with October 2016 levels as a starting point). The new agreement also caps the combined output of Nigeria and Libya below 2.8 million barrels per day. Both countries had been exempt from cuts due to unrest and lower than normal production. The organizations will meet again in June 2018 to discuss any adjusts to the agreement based on market conditions. OPEC and Russia combined producemore than 40 percent of the global oil supply.
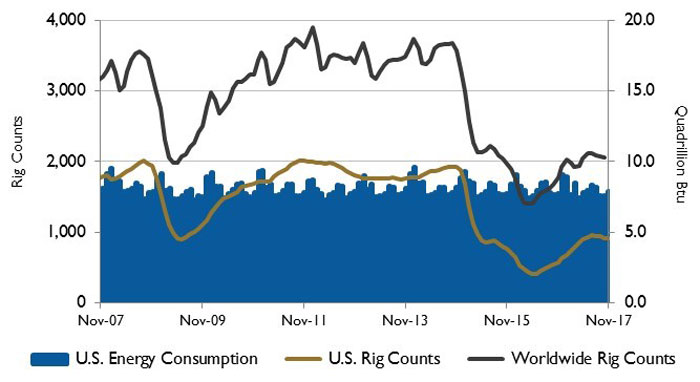 Figure 2. U.S. energy consumption and rig counts
On Wall Street for the month of November the Dow Jones Industrial Average rose 3.8 percent, the S&P 500 Index increased 2.8 percent and the NASDAQ Composite grew 2.2 percent. The Dow and S&P 500 both posted their eighth consecutive month of gains, the Dow’s longest streak of gains in the last 22 years. The markets were fueled by rising optimism about the prospects for tax reform and OPEC’s extension of curbs on oil output. The Federal Reserve Bank said that the U.S. economy has been improving at a solid rate. So far this year, the indices have made gains in the range of 18 percent to 28 percent.
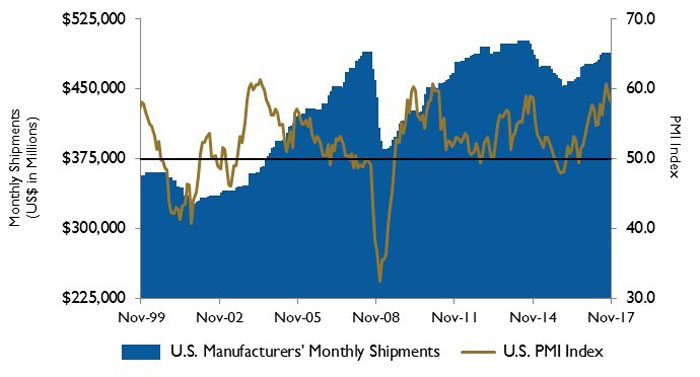 Figure 3. U.S. PMI and manufacturing shipments