


The Jordan, Knauff & Company (JKC) Valve Stock Index was up 13.2 percent over the last twelve months, while the broader S&P 500 Index was up 14.5 percent. The JKC Pump Stock Index increased 23.9 percent for the same time period.1
The Institute for Supply Management’s Purchasing Managers’ Index (PMI) decreased to 54.8 percent in April from 57.2 percent in March. Although this was the third consecutive monthly decline, the index has shown eight consecutive months of expansion. Large dips were seen in the New Orders Index, which declined 7.0 percentage points to 57.5 percent, and the Employment Index, which fell 6.9 percentage points to 52.0 percent. Survey respondents cited better economic conditions and a more favorable outlook.
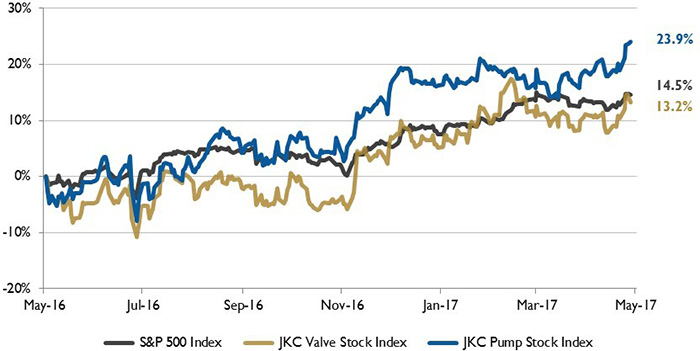 Figure 1. Stock indices from May 1, 2016 to April 30, 2017. Local currency converted to USD using historical spot rates. The JKC Pump and Valve Stock Indices include a select list of publicly traded companies involved in the pump and valve industries weighted by market capitalization. Source: Capital IQ and JKC research.
 The Bureau of Labor Statistics reported an increase of 211,000 new jobs in April led by the leisure and hospitality industry, which added 55,000 jobs. Education and health services added 41,000, while business and professional services increased by 39,000. Manufacturers added 6,000 workers in April.
The U.S. has added an average of 185,000 jobs per month for the first four months of this year. The unemployment rate dropped to a post-recession low of 4.4 percent.
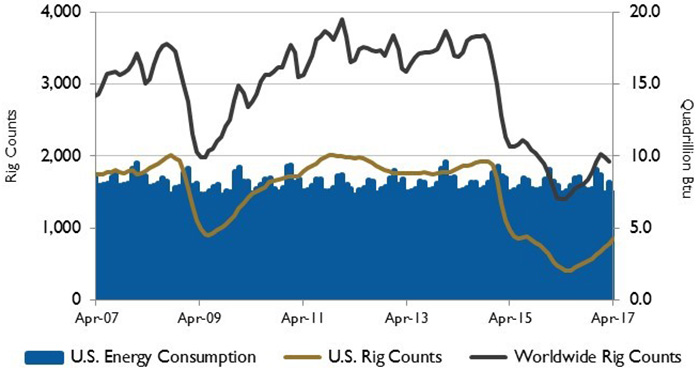 Figure 2. U.S. energy consumption and rig counts. Source: U.S. Energy Information Administration and Baker Hughes Inc.
Real gross domestic product (GDP) increased at an annual rate of 0.7 percent in the first quarter of 2017 according to the “advance” estimate released by the Bureau of Economic Analysis. The deceleration from the previous quarter reflected a slowdown in personal consumption, downturns in private inventory investment and lower state and local government spending that were partly offset by an upturn in exports and growth in both nonresidential and residential fixed investment.
Due in part to higher expected U.S. and Brazilian crude oil production growth, the U.S. Energy Information Administration (EIA) expects world crude oil and liquid fuels supply to grow by 1.1 million barrels per day in 2017 and by 1.9 million barrels per day in 2018. U.S. crude oil production was an estimated 9.1 million barrels per day in March, the highest level in a year. U.S. production is forecast to grow by an average of 0.3 million barrels per day in 2017 and by 0.7 million barrels per day 2018.
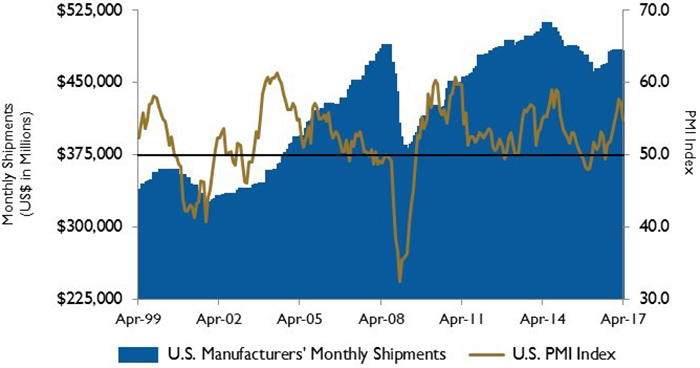 Figure 3. U.S. PMI and manufacturing shipments. Source: Institute for Supply Management Manufacturing Report on Business and U.S. Census Bureau.
Crude oil prices declined in early March as U.S. crude oil inventories built to a multi-decade high. Prices declined despite voluntary production cuts by the Organization of the Petroleum Exporting Countries (OPEC) and some non-OPEC producers in the first quarter of 2017.
The EIA believes that OPEC crude oil production volumes will increase and approach pre-agreement levels during the second half of 2017.
On Wall Street the Dow Jones Industrial Average grew 1.3 percent, the S&P 500 Index rose 0.9 percent and the NASDAQ Composite was up 2.3 percent for the month of April. Investors were concerned about weak auto sales and a dip in manufacturing growth. However, strong quarterly earnings reports, especially from Amazon and Alphabet, moved the benchmarks ahead for the month.
Reference
1. The S&P Return figures are provided by Capital IQ.
These materials were prepared for informational purposes from sources that are believed to be reliable but which could change without notice. Jordan, Knauff & Company and Pumps & Systems shall not in any way be liable for claims relating to these materials and makes no warranties, express or implied, or representations as to their accuracy or completeness or for errors or omissions contained herein. This information is not intended to be construed as tax, legal or investment advice. These materials do not constitute an offer to buy or sell any financial security or participate in any investment offering or deployment of capital.