


The Jordan, Knauff & Company (JKC) Valve Stock Index was down 25 percent over the last 12 months, while the broader S&P 500 Index was down 3.9 percent. The JKC Pump Stock Index decreased 24.5 percent for the same time period.1
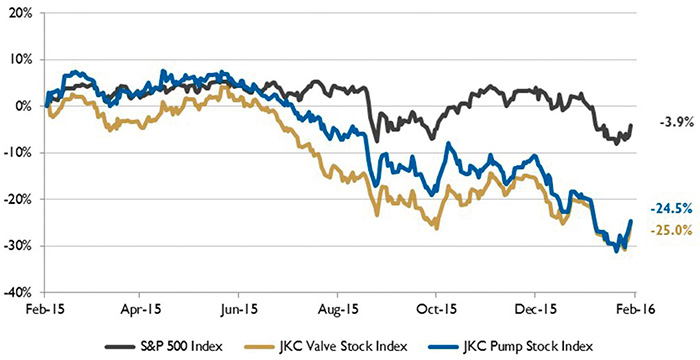 Figure 1. Stock indices from Feb. 1, 2015, to Jan. 31, 2016. Source: Capital IQ and JKC research. Local currency converted to USD using historical spot rates. The JKC Pump and Valve Stock Indices include a select list of publicly traded companies involved in the pump and valve industries weighted by market capitalization.
For the fourth month in a row, the Institute for Supply Management’s Purchasing Managers’ Index (PMI) remained in contraction territory. In January, the Index registered 48.2 percent, a 0.2 percentage point increase from the seasonally adjusted December reading of 48 percent. The New Orders Index registered 51.5 percent, an increase of 2.7 percentage points over December. Only eight of the 18 manufacturing industries reported growth during the month, including textile mills, wood products, miscellaneous manufacturing, and printing and related support activities. Respondents in chemical products, primary metals, plastics and rubber, and miscellaneous manufacturing reported a strong start to the year. The PMI averaged 50.9 percent over the last 12 months, with the high point of 53.3 percent occurring in February of last year.
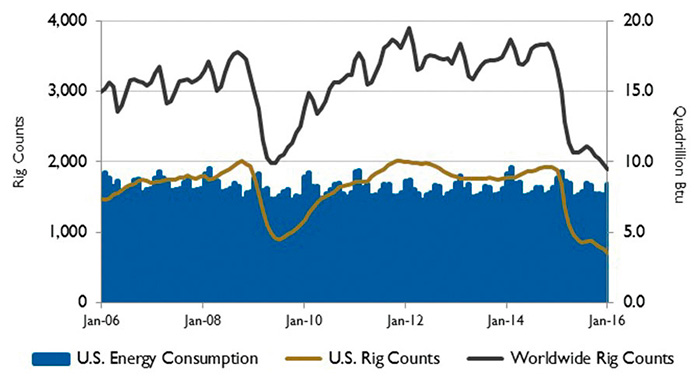 Figure 2. U.S. energy consumption and rig counts. Source: U.S. Energy Information Administration and Baker Hughes Inc.
The U.S. Energy Information Administration (EIA) expects crude oil prices to remain relatively low over the next two years as supply continues to outpace demand this year and more oil is placed into storage. The EIA forecasts that Brent crude oil prices will average $40 per barrel in 2016 and $50 per barrel in 2017. West Texas Intermediate oil prices are expected to average $38 per barrel this year and $47 in 2017.
Global oil inventories are expected to increase by 0.7 million barrels per day in 2016 before becoming more balanced at the end of 2017. Over the next two years, OPEC members are expected to account for most of the oil production growth. OPEC production is forecast to increase by 0.5 million barrels per day this year, with Iran accounting for most of the increase. The EIA expects global consumption of oil and other liquid fuels to increase by 1.4 million barrels per day in both 2016 and 2017.
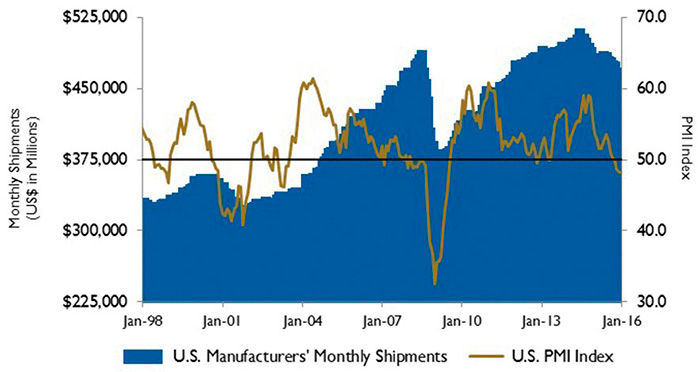 Figure 3. U.S. PMI and manufacturing shipments. Source: Institute for Supply Management Manufacturing Report on Business® and U.S. Census Bureau.
In January, the U.S., European Union and the United Nations lifted oil-related sanctions that limited Iran’s ability to sell its oil on the global market since 2011. As a result of the sanction relief, Iran’s oil production and exports are expected to increase. Iran’s crude oil production is forecast to be 3.3 million barrels per day by the end of this year and 3.7 million barrels per day by the end of 2017, compared with an average of 2.8 million barrels per day in 2015. Since Iran’s oil consumption is expected to remain flat over the next two years, the production increase will likely be sold in the export markets.
On Wall Street, the Dow Jones Industrial Average was down 5.5 percent, the S&P 500 Index decreased 5.1 percent and the NASDAQ Composite fell 7.9 percent for the month of January. Declines in energy, technology, consumer discretionary and biotech stocks brought down the indices during the month. Weak economic growth in China, the continued oil supply glut, tension in the Middle East and a stronger U.S. dollar contributed to dampened investor sentiment.
Reference
1. The S&P Return figures are provided by Capital IQ.
These materials were prepared for informational purposes from sources that are believed to be reliable but which could change without notice. Jordan, Knauff & Company and Pumps & Systems shall not in any way be liable for claims relating to these materials and makes no warranties, express or implied, or representations as to their accuracy or completeness or for errors or omissions contained herein. This information is not intended to be construed as tax, legal or investment advice. These materials do not constitute an offer to buy or sell any financial security or participate in any investment offering or deployment of capital.