


Interest in energy efficiency is not new. During the last three decades, public and private companies, non-profit organizations, governments and consumer groups have collectively sought to push industry to adopt or accelerate efficiency initiatives. While significant successes have been achieved at many facilities, according to published reviews, the majority of companies have only made moderate levels of investments and patterns of implementations have been inconsistent.
Today, the imperative to improve industrial energy efficiency has never been greater. There are well-understood drivers for improving equipment and process efficiency including environmental constraints, peaking oil production and aging infrastructure. The growing level of public interest and public investment in energy efficiency during the past five years has quickened the pace.
Achieving energy efficiency is not an academic theory. It is a growing reality that must become a core management practice in all industrial facilities. The opportunity for enormous cost savings is compelling.
Think of it as end users having a large, accessible pool of low-cost fuel at their fingertips, and all they have to do is make the investment to tap this abundant source.
Why would anyone not take advantage of this opportunity? Isn’t this an essential component of any strategy to achieve a competitive advantage?
During the last decade, interest in these efficiency opportunities have increased, and even more important, end users have realized that many of the perceived barriers to achieving the associated savings can be summarily addressed and surmounted.
Clearly, the overall lack of progress has been due, in part, to a lack of understanding and appreciation of how efficiency drives cost savings. As a result, there has been a lag time in making the required investments.
Often, energy efficiency projects are perceived as ambiguous and, as a result, are considered less attractive than traditional capacity expansion and modernization investments. The old adage “when in doubt, don’t” should no longer apply to energy efficiency projects. The barriers, both real and perceived, are common across industrial facilities and will certainly require some level of innovation to overcome; e.g., providing information and training, dedicating resources (not bound by operations to focus on short-term fire-fighting issues) and appropriating proper levels of financing (capital that is not in competition with other high value projects that are focused on production).1
In industrial plants, managing energy consumption, not just supply, must become a critical component of the equation for improving profitability. When considered, process pumps, as an asset group, are typically the largest consumer of energy in the majority of continuous process plants. Furthermore, when you consider that every watt of power wasted by over-sized or over-throttled pumps becomes a destructive force that lowers overall process reliability, optimizing pump performance is the key to achieving a triple benefit—lower energy costs, lower maintenance costs and improved process control. This is an essential strategy for any plant management that wants to improve the plant’s sustainability, productivity and cost position.
Pump System Efficiency Opportunity
According to the Department of Energy (DOE), more than 13.5 million electric motors convert electricity into useful work in industrial process operations in the U.S. Industries spend more than $33 billion annually for electricity dedicated to electric-motor-driven systems. Industrial motor system electricity consumption is 24 percent of all U.S. electricity sold in 1994. Because nearly 70 percent of all electricity used in industry is consumed by some type of motor-driven system, increases in the energy efficiency of existing motor systems will lead to dramatic nationwide cost savings.
Improvements in motor systems as well as management practices can yield significant energy savings, up to 42 percent, according to a recently revised American Council for an Energy-Efficient Economy (ACEEE) reference manual - titled Energy-Efficient Motor Systems: A Handbook on Technology, Program, and Policy Opportunities. This report contains an in-depth analysis of motor system energy use and savings potential by market segment.
In most industries, the report identified centrifugal pumps as the largest consumers of electric motor energy. Also, among all rotating assets in the plant, process pumps had the highest overall potential for electrical energy savings.
This trend is consistent with the findings of a Finnish Technical Research Center published in a 1996 report, “Expert Systems for Diagnosis and Performance of Centrifugal Pumps.” The report revealed that the average pumping efficiency, across the 20 plants and 1,690 pumps studied, was less than 40 percent, with 10 percent of the pumps operating below 10 percent efficiency. Also, average motor efficiency was 81 percent with pump seal leakage being the fault that causes the highest downtime and cost. While this report is more than a decade old, these stats have not changed significantly when considering the state of today’s pump population.
The DOE motor efficiency report also noted that motor systems equipped with variable speed drives (VSD) account for only 4 percent of motor energy usage, compared to a potential for application on 18 to 25 percent of the total energy used by motor systems. Only the largest plants had implemented the most common kinds of system improvements and patterns of knowledge, even among the largest companies, is inconsistent.
Engineering Strategies for Efficiency Improvement
Pump system assessments help qualify and quantify the best opportunities to improve system efficiency and reliability. Plant-wide assessments identify the following process modifications that offer the most potential for efficiency improvements:
- Motor efficiency via new replacement or upgrade
- Best match between component size and load requirement
- Use of speed control instead of throttling or bypass mechanisms
- Reduced load on the motor through improved process and system design
Also, when performing system assessments, the following pump symptoms are good indicators of potential opportunity:
- Throttled valve
- Bypass line normally open
- Presence of cavitation noise
- Constant pump operation in a batch environment
- Multiple, parallel pump system with the same number of pumps always operating
The application of intelligent variable frequency drive (VFD) control technology improves reliability when employed to make the following adaptations:
- Automatically adjusts to process and pump system changes
- Fault tolerance; e.g., can slow the pump for protection
- Understands when to resume safe operation
Intelligent pumping systems using process instruments and controls allow for smoother transitions (start-ups and production changes), tighter control during continuous operation and faster diagnostics of pump system problems before product quality or process operation is negatively affected.
A Case in Point: Industrial Cooling Tower System
Industrial cooling towers are used to transfer waste heat to the atmosphere and typically use evaporation to cool the working fluid to near wet-bulb air temperature.
A recent energy efficiency study involved 16 vertical turbine pumps installed across two adjacent cooling towers. All the pumps feed into a common discharge header that supplies process water to the different plant segments. Wide swings in flow are common on a daily and seasonal basis.
Depending on flow demand, typically 11 pumps operate in the winter and 15 in the summer. A 460-volt, 400-horsepower motor running at 1,180 rpm drives the pumps to deliver 6,875 gallons per minute (gpm) at 180 feet, at the original design point. The verticals are two-stage pumps with discharge isolation valves that are 40 percent open, on average.
To satisfy varying demand, the pumps are turned on and off manually. The header pressure ranged from 60 to 70 psig (1-year trend).
Typically, the pressure and flow was around 68 psig and 90,000 gpm during the summer months and 62 psig and 60,000 gpm during the winter. Also, the system static head was approximately 80 feet.
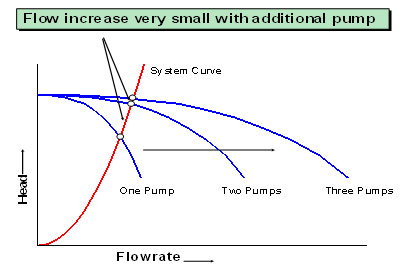
Note: In parallel pumping systems, when turning on additional pumps, more incremental flow is realized in a high static head system than in a low static head system.
When parallel pumps are turned on in sequence, the system pressure (on the composite pump curve) increases while the incremental flow increase is less for each new pump (n + 1) that is energized or vice-versa (n – 1).
Therefore, each pump that is turned off allows the remaining pumps to run farther out on their individual pump curves (see Figure 1).
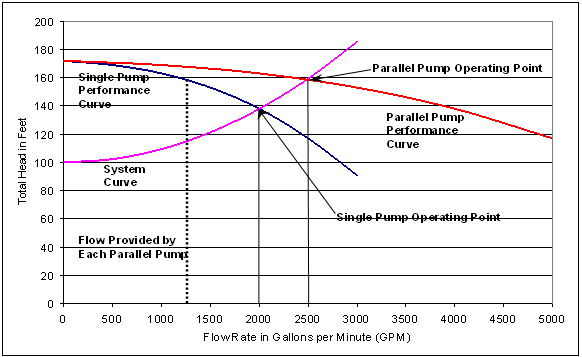 |
Figure 1. Composite curve for two identical parallel pumps
 |
|
Figure 2. Low static head parallel pumping system (operating point) |
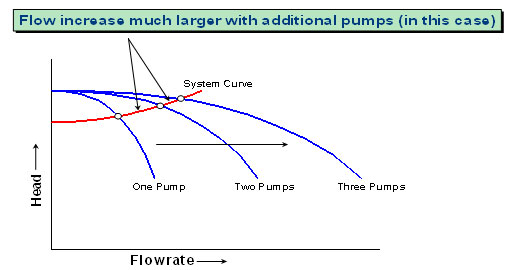 |
| Figure 3. High static head parallel pumping system (operating point) |
Energy Savings for Original Design vs. Actual Operating Efficiencies
Calculations for one pump is shown as representative of the entire system:


Recommendations
1. Install new or refurbished impellers (i.e., trim all impellers to the same diameters of 14.6 inches/14.5 inches, for Stage 1 and Stage 2 respectively. Fully open the isolation valves (or open to as high of a percentage as possible without over-loading the motor) and run up to four less pumps than normal for the day and season.
48 kW efficiency improvement x 8 operating pumps (future state) ≈ 384 kW savings from increased pump efficiency
2. Turn off four pumps versus typical operation (Towers 2 and 2A)
232 kW x 4 Pumps = 928 kW
928 x $0.038/kWhr x 8640 hours/year = $304,680 energy savings
Summary: Total potential kilowatt savings (928 kW + 384 kW) = 1321 kW (Total)
1321 x $0.038/kWhr x 8640 hours/year = $433,710 energy savings (Total)
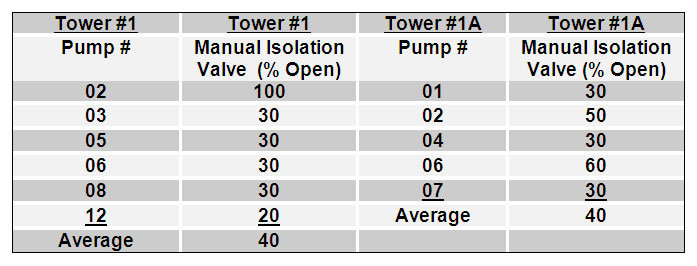 |
| Table 1. Observed valve position |
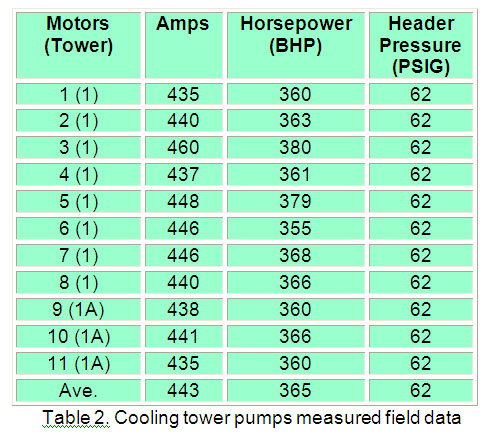 |
Table 2. Cooling tower pumps measured field data
The cooling tower system optimization project is a classic example of how a focus on efficiency has driven savings in energy consumption. It illustrates a common practice of over-sizing the pumps to meet system demand. The discharge header and piping have a relatively small friction loss, compared to the pump’s design head, requiring that pressure be bled off, across the isolation valve, to keep the pumps from running too far off the end-off the pump curve, which resulted in motor trips. By trimming the two-stage pumps’ impeller diameters to minimum and fully opening the discharge valve(s), each pump could operate closer to best efficiency point (BEP) and deliver approximately 2,000 gpm extra capacity.
These mechanical changes, in turn, resulted in four of the vertical turbine pumps, on average, being turned off year-round for significant energy savings. Furthermore, while not quantified, the operating pumps should experience longer mean time between failure (MTBF) due to operating closer to BEP on the individual pump curves. Improving energy efficiency in pumping system and other process systems can be a key component of management strategies to increase competitive advantage. A valuable, low-cost source of “fuel” is available for those facilities that have the focus to take advantage of it.
References
1. "Unlocking Energy Efficiency in the U.S. Economy," McKinsey & Company, July 2009.