


Exploring the digitization methods of pump power and efficiency curves
Second of Two Parts
More than 150 pump manufacturers present their pump performance data via electronic means. These digital pump catalogs can be found online, within stand-alone pump selection software and through select hydraulic analysis software packages. Thousands of engineers worldwide use these catalogs to evaluate and select the pumps that best meet their needs. Part One of this article detailed the digitization of pump performance curves and the accuracy ramifications from different digitization methods. In Part Two, the digitization of the pump power and efficiency curves will be explored.
To recap Part One, the main function of a pump selection program is the ability to digitally reproduce the manufacturer's pump performance data accurately and to create a selection list of pumps that meet the customer's criteria.
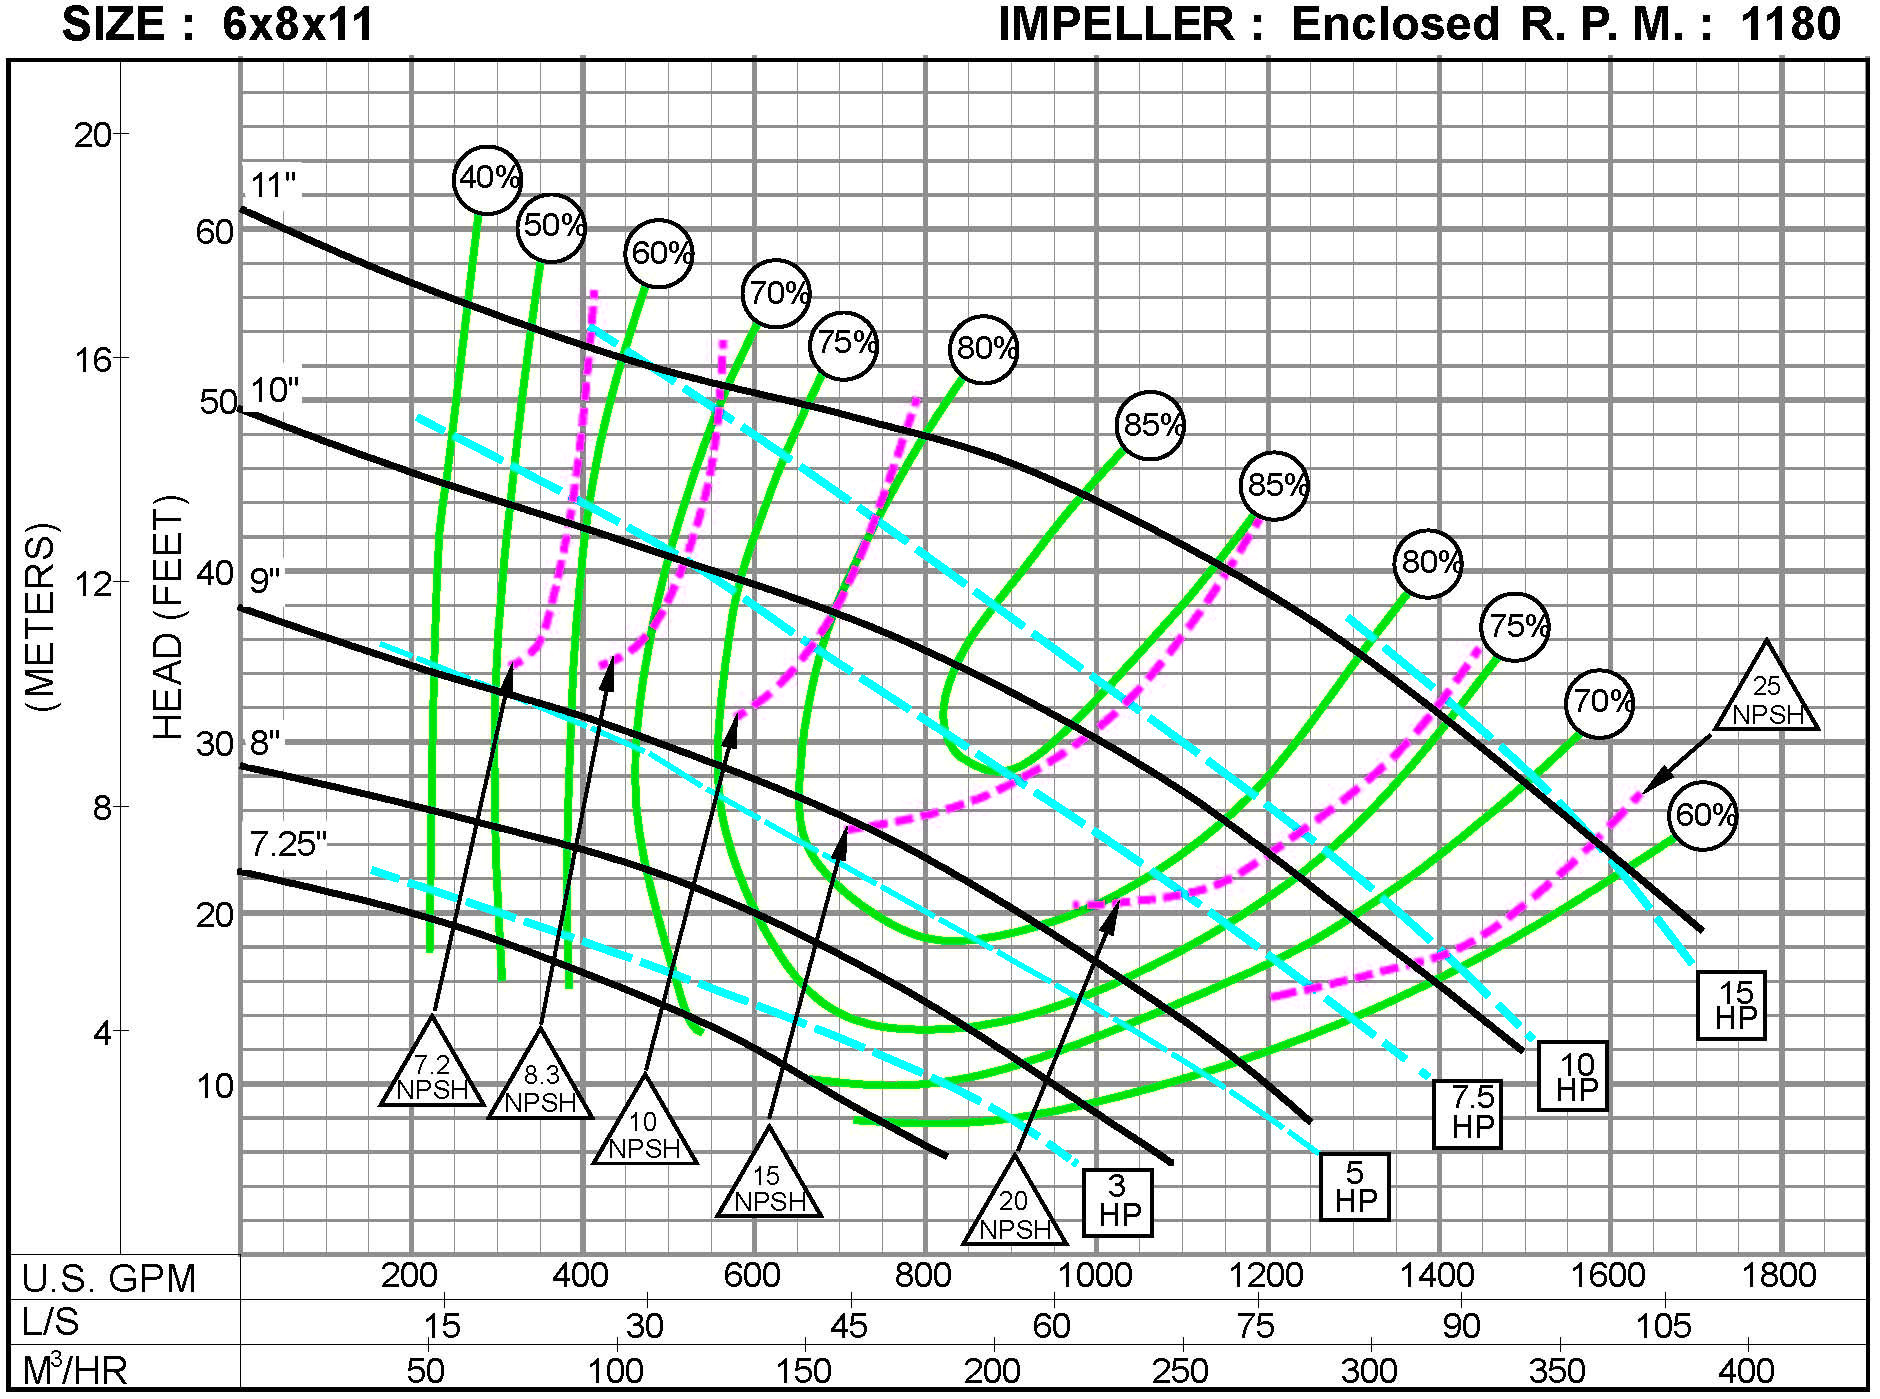 |
| Figure 1. A manufacturer's published curve |
Figure 1 shows a detailed manufacturer's pump curve. This is an example of what the manufacturer might have available in a paper catalog or in pdf format. It includes the flow versus head performance curves as well as isometric curves for efficiency, power and NPSHr. These curves accurately represent the performance of the indicated pump in accordance with the ANSI/HI 1.6-2000 Centrifugal Pump Tests standard.
For a software program to understand and use this pump performance data, the data must first be converted into a form that can be read by the program. This digitization process must accurately reflect the manufacturer's published pump curve to aid the customer in evaluating the pump for an application. Part One revealed the shortcomings of using a simple polynomial regression analysis to store and display the manufacturer's performance curves. Areas occur in which the digitized curve deviated significantly from the manufacturer's curve. It was also shown that a cubic spline regression analysis rendered a much more precise curve.
Power and Efficiency Curves
In addition to the standard flow versus head performance curves, many manufacturers also include curves for pump power and pump efficiency. It must be stressed that pump efficiency and pump power are functions of each other. The formulas relating power and efficiency are:
bhp=(Q x H x ρ)/(247000 x ηP) and ηP=(Q x H x ρ)/(247000 x bhp)
Where:
bhp = brake horsepower
ηP = pump efficiency (expressed as a decimal)
Q = flow rate (gpm)
H = total head (ft.)
ρ = fluid density (lb./ft.3)
Power is calculated with efficiency as a parameter and vice versa. To reproduce accurate and trustworthy results, one set of data must be gathered from the pump manufacturer, and the other set of data must be calculated. When generating curves, it is not accurate for a software program to try to collect and reproduce both sets of data from the manufacturer. This would leave open the possibility of errors. An end user might select a flow, head and efficiency from the graph and then perform a hand calculation of the corresponding power to find that the calculated power does not match up with the power shown on the graph.
For this reason, only one set of empirical data, efficiency or power, should be taken from the manufacturer. The other should be calculated. Also, the efficiency data reported by most pump manufacturers typically has much more granularity than the power data. That is to say, there is typically a wider range of efficiency values over the range of pump operation than the range of power values. For this reason, it is usually more accurate to digitize the manufacturer's efficiency data and then calculate the power data, than the other way around.
Example One
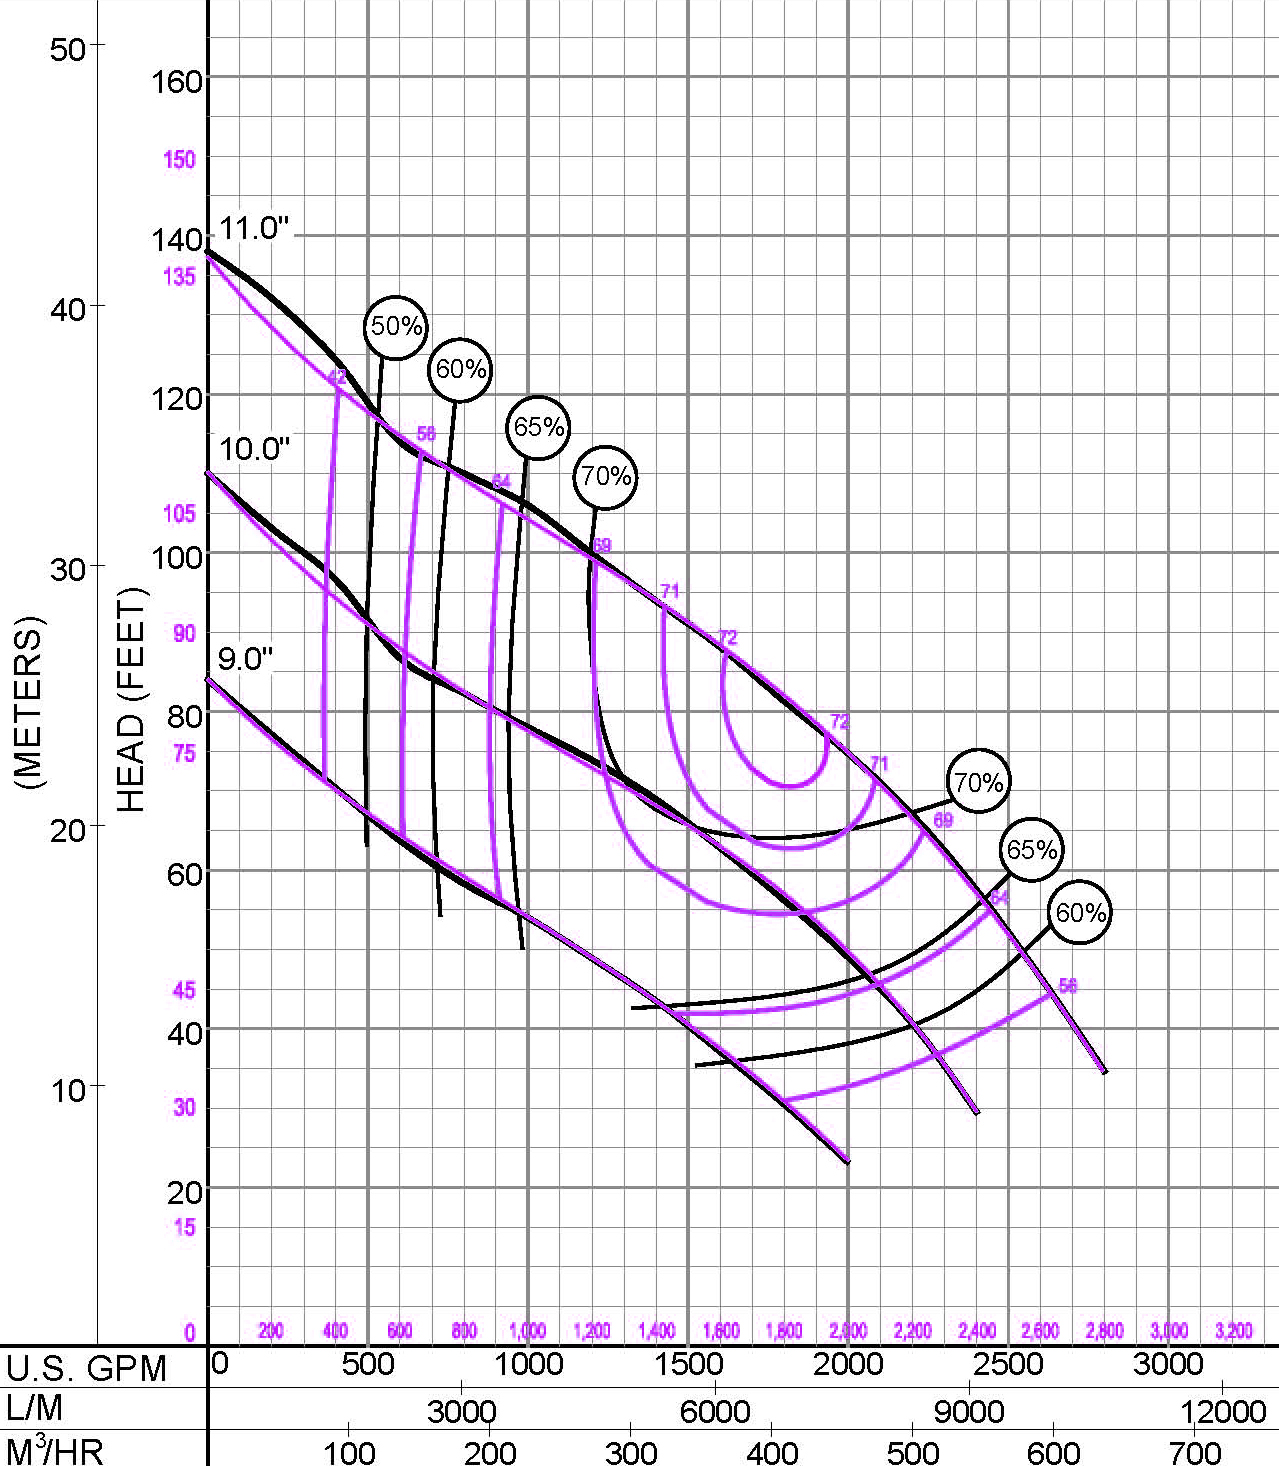 |
| Figure 4a. Performance and efficiency curves |
To see the effect that digitizing can have on power and efficiency curve generation, consider the curves in Figures 4a and 4b. In this example, the pump selection program attempted to digitize the isometric power curves and then calculate isometric efficiency curves from the power. Notice that the software rendered efficiency curves in Figure 4a are well off the mark, particularly in and around the 70-percent-and-up operating range. Not only are the isometric efficiency curves misaligned, but the percentages clearly do not match up with the published curve. The pump's overall efficiency is overstated by up to 3 percent.
If a customer were to download these performance curves (Figure 4a in black) from the pump manufacturer's technical literature and then pulled up the performance curves (Figure 4a in pink) from this pump selection software, it is virtually impossible to tell that these curves are from the same pump. This introduces confusion and a lack of confidence in the software's pump performance data to the customer.
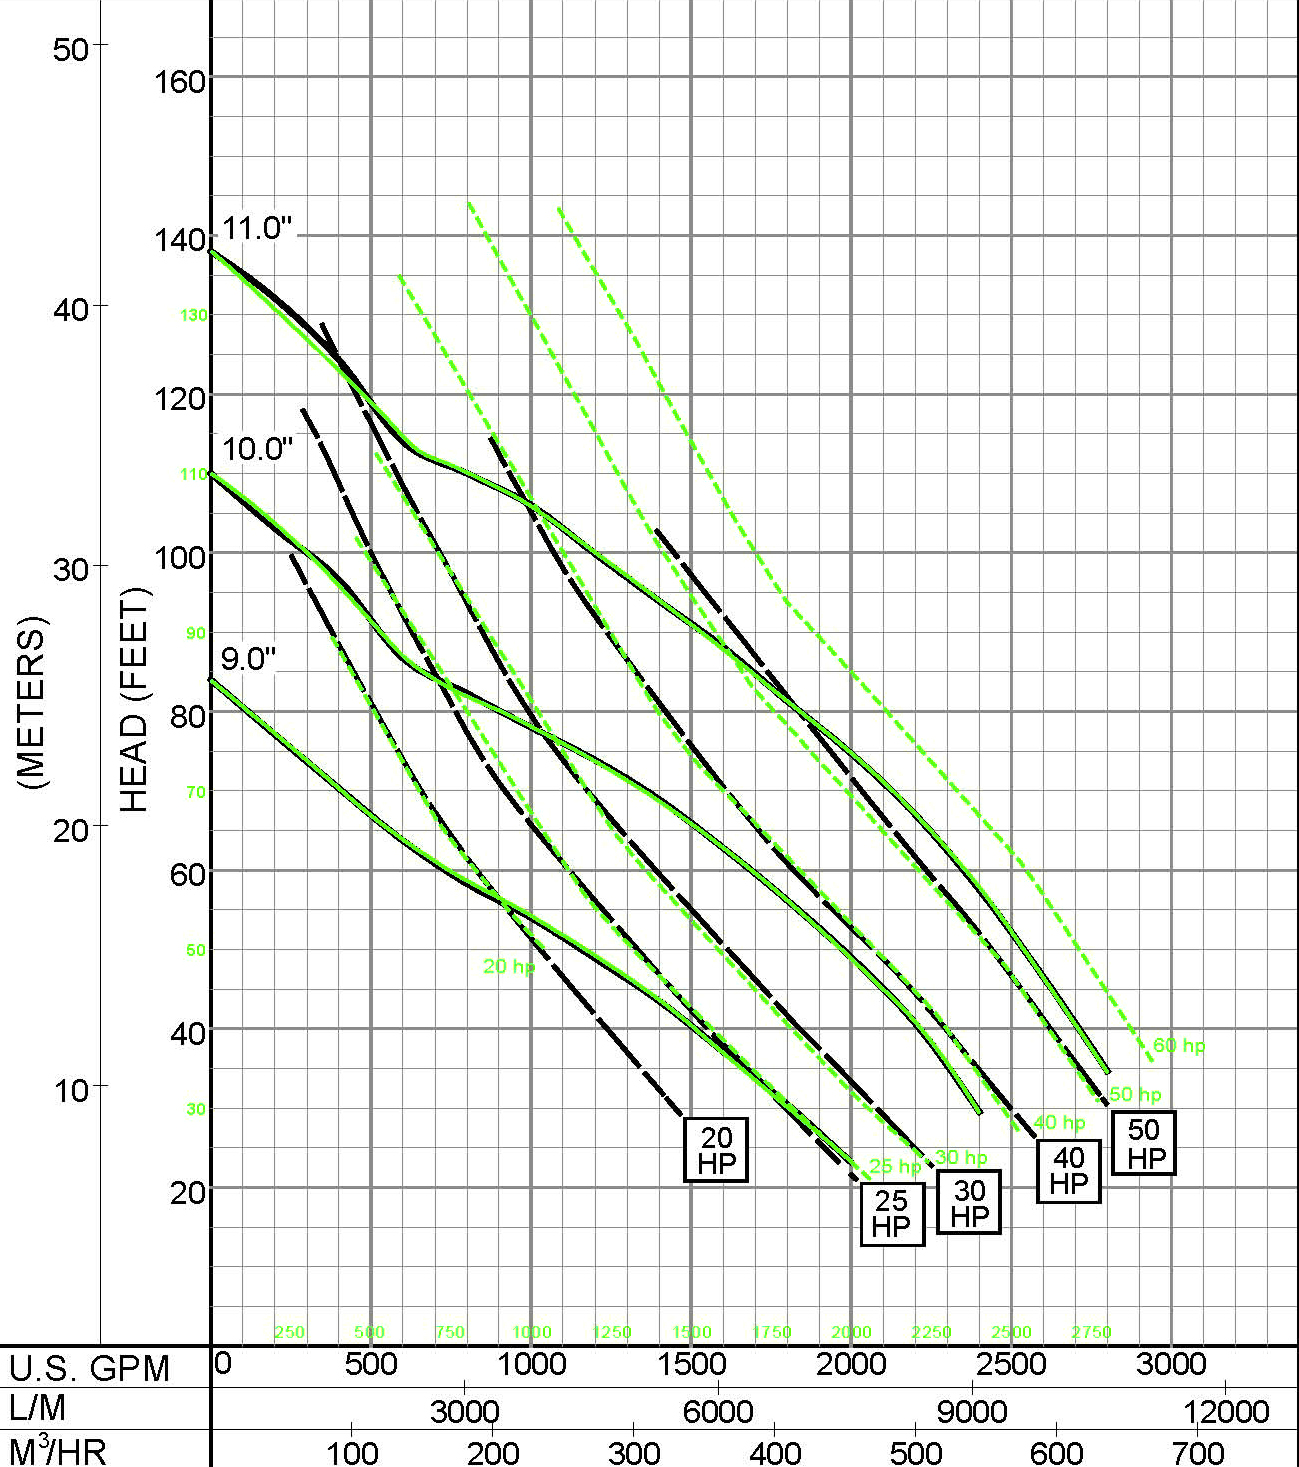
In Figure 4b, the manufacturer's performance and power curves are overlaid with the pump selection software's curves. The power curves start off tracking fairly well at lower flow rates. However, the range of displayed power has been severely limited on the 30-horsepower and 50-horsepower curves at higher flow rates. They do not extend to run out flow rates as they should. This is a case of missing data and can also introduce confusion much like the poorly rendered efficiency curves.
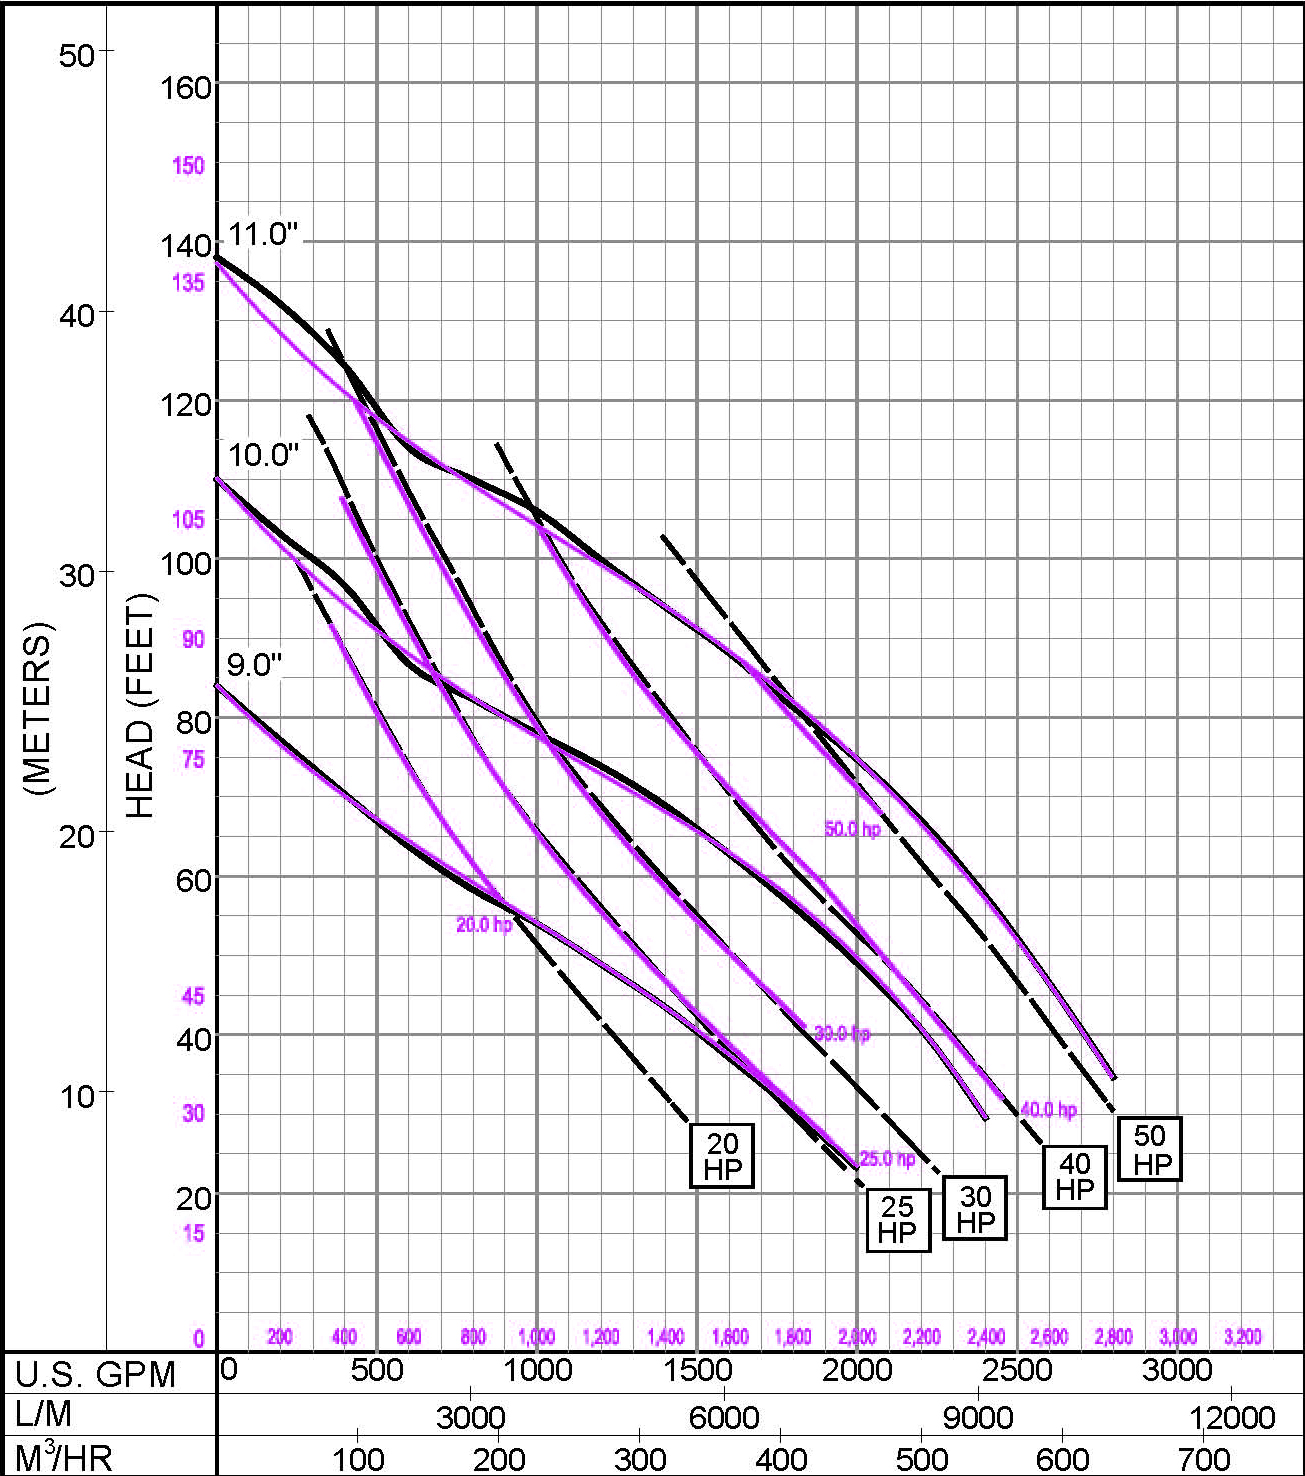 |
| Figure 4b. Performance and power curves |
Two serious engineering issues can arise due to the inaccuracies of these curves. The first relates to the efficiency errors. For example, consider if this pump were operated with an 11-inch impeller at its best efficiency flow rate of 1,800 gallons per minute for one year, and assume that utility costs are $0.15 per kWh. Overstating the efficiency by only two percentage points will, over the course of a year, increase the operating costs of this pump by almost $1,500. With the increase in energy audits throughout the industry, particularly within government agencies and municipalities, this type of inaccuracy is bound to come to light and cast doubt on the validity of the manufacturer's pump performance data.
A second issue lies with respect to the power curves. The truncated power curves shown in the Figure 4b do not extend to run out flow rates. This is important because pump motors are most often sized to the non-overloading power on the design curve, which is frequently at run out flow rates. If customers cannot decipher what the power is at run out flow rates, then they will not be able to properly size and select a motor.
Example Two
 |
 |
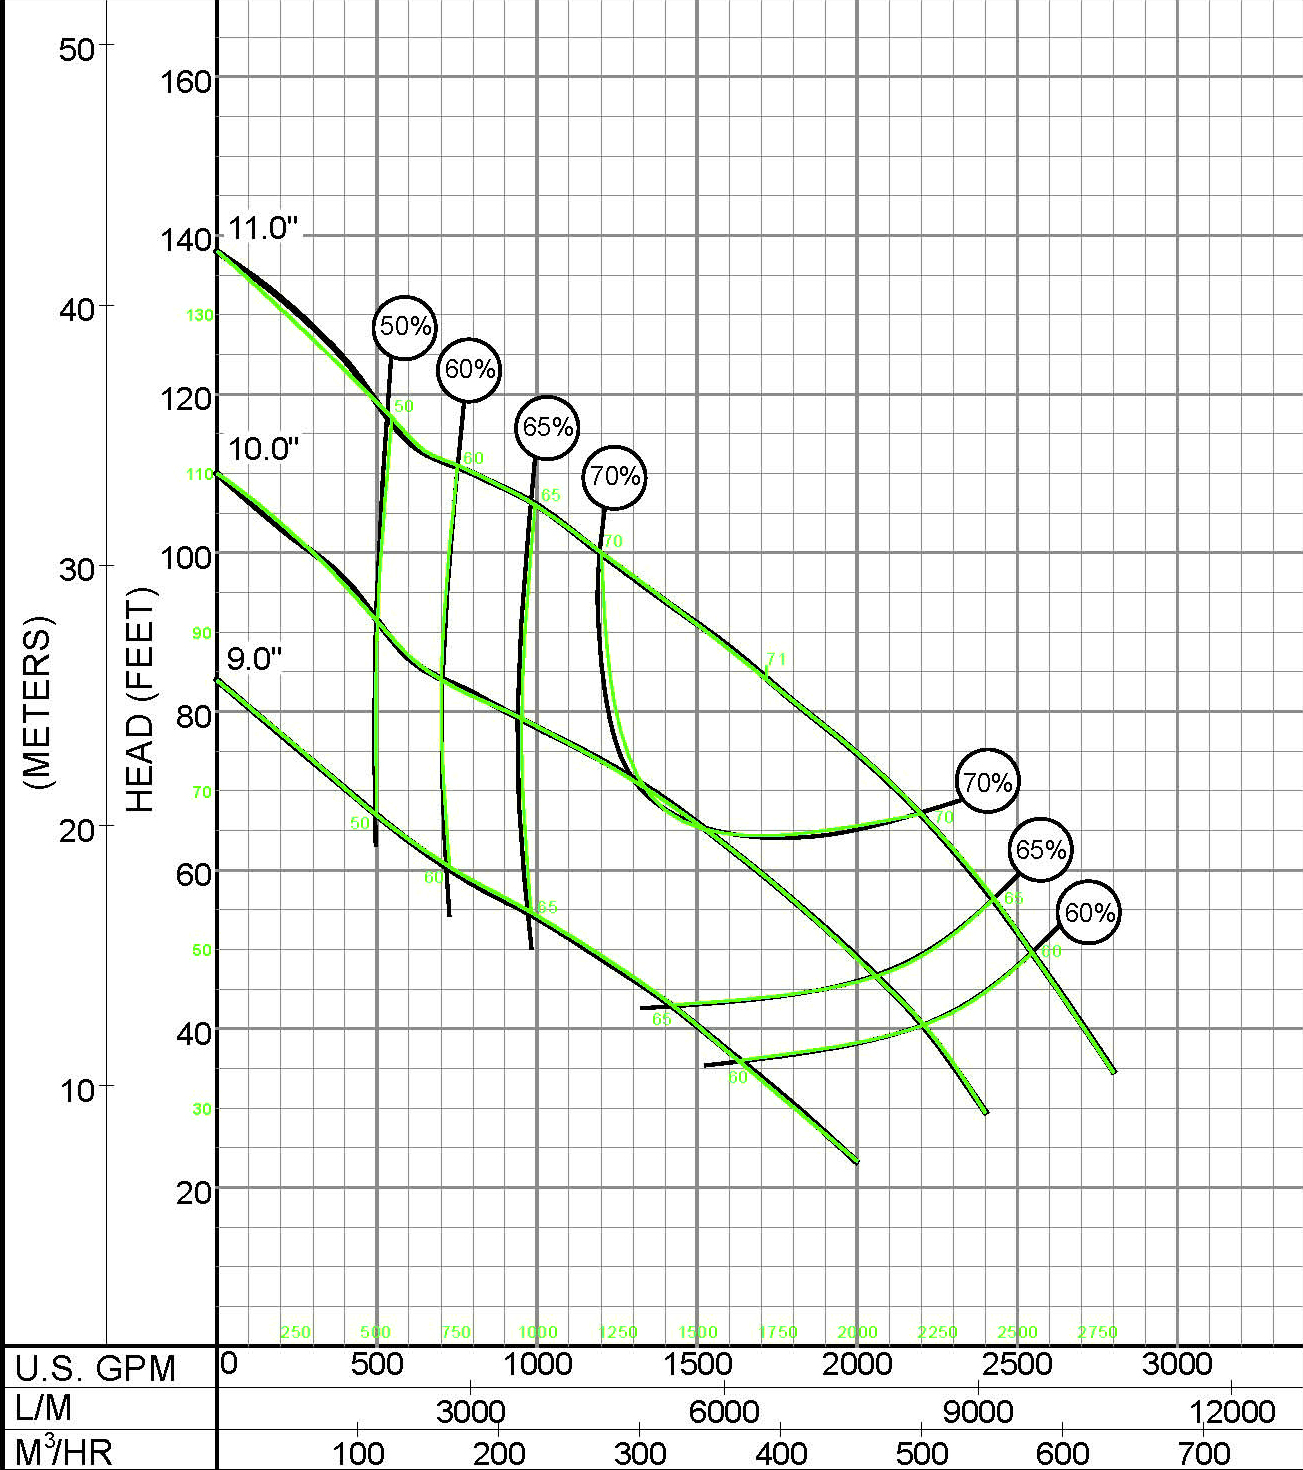
| Figure 5a. Performance and efficiency curves from cubic spline regression analysis. | Figure 5b. Performance and power curves from cubic spline regression analysis. |
Now consider the curves in Figures 5a and 5b. In this case, the pump selection software properly digitized the efficiency curves from the manufacturer using a cubic spline regression analysis. The isometric efficiency curves are dead accurate at every point in the graph, and the efficiency is never overstated. In figure 5b, the power curves also track extremely well with the manufacturer's, given that they are calculated power curves, and more importantly, the endpoints at the run out flow rates are accurate.
Conclusion
Using a pump selection program that accurately represents the manufacturer's pump performance is a necessity. Inaccuracies in curve digitization and rendering can lead to improper pump and motor selections as well as faulty operating cost calculations. Users should be aware of the digitization techniques employed by their pump selection software, and the information in these articles should aid them in making an informed decision when choosing a software package.