


The Jordan, Knauff & Company (JKC) Valve Stock Index was up 23.3 percent over the last 12 months, while the broader S&P 500 Index was up 19.4 percent. The JKC Pump Stock Index increased 27 percent for the same time period.1
The Institute for Supply Management’s Purchasing Managers’ Index (PMI) increased 1.7 percentage points to reach 57.7 percent in February, hitting a two-and-a-half-year high. New orders rose to a three-year high of 65.1 percent. Current production climbed more than 5 points above its six-month average to 62.9 percent. Survey comments indicated strong sales and demand. Customer inventories fell 1 percent to 47.5 percent, indicating that inventories are too low. Manufacturers’ inventories grew 3 percent to 51.5 percent, increasing for the first time in almost two years.
The U.S. Census Bureau reported that new factory orders increased for the second straight month in January to their highest level since July 2015. The monthly gain of 1.2 percent was driven by large gains in defense and nondefense aircraft sales. Durable and nondurable goods orders were up 2 percent and 0.4 percent, respectively. For the month, demand for both fabricated metal products and furniture and related products increased 2.3 percent. New orders for durable goods excluding transportation are up 2.5 percent over January 2016. Factory shipments have risen 4.9 percent over the past 12 months.
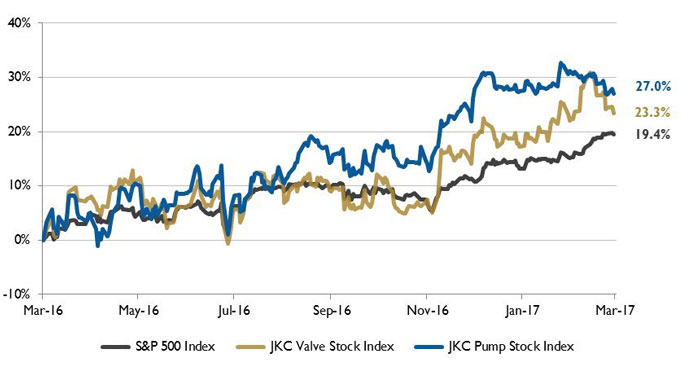 Figure 1. Stock indices from March 1, 2016, to Feb. 28, 2017 Source: Capital IQ and JKC research. Local currency converted to USD using historical spot rates. The JKC Pump and Valve Stock Indices include a select list of publicly traded companies involved in the pump and valve industries weighted by market capitalization.
Canada is the largest energy trading partner of the U.S. with imports from Canada exceeding U.S. energy exports to Canada by a wide margin. In 2016 the value of U.S. energy imports from Canada was $53 billion, while the value of U.S. energy exports to Canada was only $14 billion. Crude oil makes up the largest segment of energy imported from Canada, and Canada is the largest source of U.S. crude oil imports, providing 41 percent of total U.S. imports in 2016.
Mexico is second only to Canada in energy trade with the U.S. This trade has been characterized by Mexico’s sale of crude oil to the U.S. and by U.S. net exports of refined petroleum products to Mexico. In the past the value of U.S. energy imports from Mexico were two to three times greater than the value of U.S. energy exports to Mexico. This situation has changed significantly in recent years.
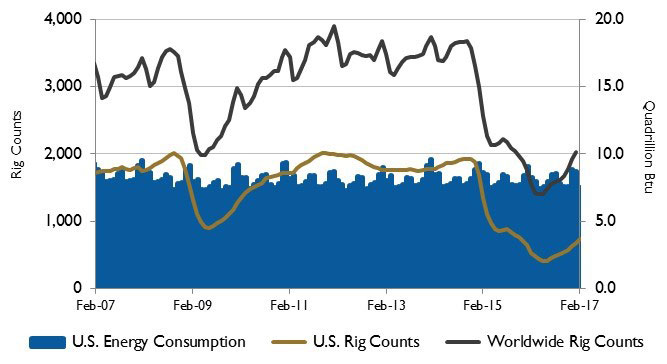 Figure 2. U.S. energy consumption and rig counts Source: U.S. Energy Information Administration and Baker Hughes Inc.
In 2015 and 2016, due to rapidly growing volumes of both petroleum products and natural gas, the value of U.S. energy exports to Mexico exceeded the value of U.S. energy imports from Mexico as volumes of Mexican crude oil sold to the U.S. continued to decline. In 2016, the value of U.S. energy imports from Mexico was $8.7 billion, while U.S. exports to that country were $20.2 billion.
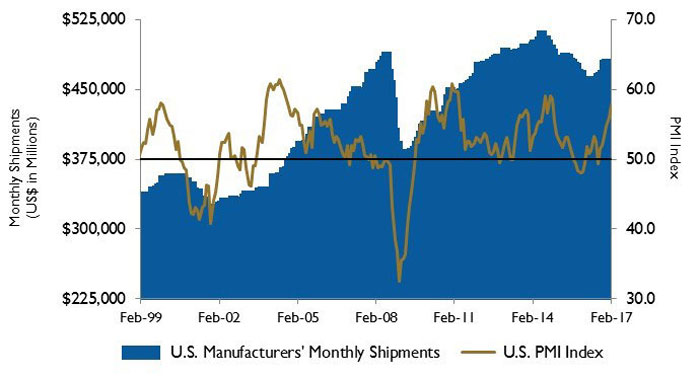 Figure 3. U.S. PMI and manufacturing shipments Source: Institute for Supply Management Manufacturing Report on Business and U.S. Census Bureau
 On Wall Street all of the major indices advanced for the month of February. The Dow Jones Industrial Average was up 4.8 percent, the S&P 500 Index increased 3.7 percent and the NASDAQ Composite rose 3.8 percent for the month. The markets were boosted by a rally in oil prices, the Federal Reserve Bank’s positive comments on the economy, as well as upbeat earnings reports from Apple Inc., Wal-Mart Stores Inc. and Home Depot Inc.
Reference
- The S&P Return figures are provided by Capital IQ.
These materials were prepared for informational purposes from sources that are believed to be reliable but which could change without notice. Jordan, Knauff & Company and Pumps & Systems shall not in any way be liable for claims relating to these materials and makes no warranties, express or implied, or representations as to their accuracy or completeness or for errors or omissions contained herein. This information is not intended to be construed as tax, legal or investment advice. These materials do not constitute an offer to buy or sell any financial security or participate in any investment offering or deployment of capital.