


The Jordan, Knauff & Company (JKC) Valve Stock Index was up 2.9 percent over the last 12 months, while the broader S&P 500 Index was up 1.1 percent. The JKC Pump Stock Index increased 1.6 percent for the same time period.1
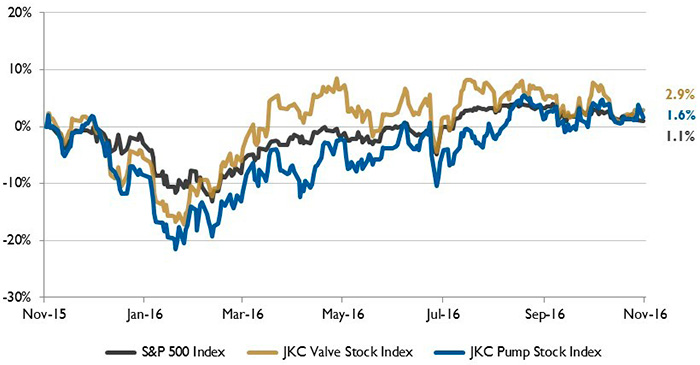 Figure 1. Stock indices from Nov. 1, 2015, to Oct. 31, 2016. Source: Capital IQ and JKC research. Local currency converted to USD using historical spot rates. The JKC Pump and Valve Stock Indices include a select list of publicly traded companies involved in the pump and valve industries weighted by market capitalization.
The Institute for Supply Management’s Purchasing Managers’ Index (PMI) increased to 51.9 percent in October from 51.5 percent in September, growing for the second straight month. Both production and exports accelerated during the month, increasing to 54.6 percent and 52.5 percent, respectively. Expanding for only the second time this year, employment grew from 49.7 percent to 52.9 percent. Eleven of the 18 industries reported employment growth including textile mills, printing, furniture, paper and electrical equipment.
The U.S. Department of Labor reported that nonfarm payrolls rose 161,000 in October and revised September’s job gains up. The unemployment rate declined to 4.9 percent. Jobs in the manufacturing sector declined by 9,000 and are down 62,000 year to date. The factory segment continues to face a strong dollar, sluggish growth abroad and low commodity prices. Average hourly wages gained 0.4 percent in October. Gains were widespread across most industries, led by the information and leisure and hospitality sectors. Over the past year, average hourly earnings are up 2.8 percent.
New factory orders rose 0.3 percent in September, led by sales of nondurable goods, which increased 0.9 percent. New orders for durable goods, excluding transportation, were up 0.1 percent. Demand was strong for motor vehicles and parts (up 2.6 percent), furniture (up 1.2 percent), machinery (up 1.1 percent), and electrical equipment and appliances (up 0.9 percent). Computers were down 0.9 percent, fabricated metal products fell 0.6 percent and primary metals dropped 0.3 percent.
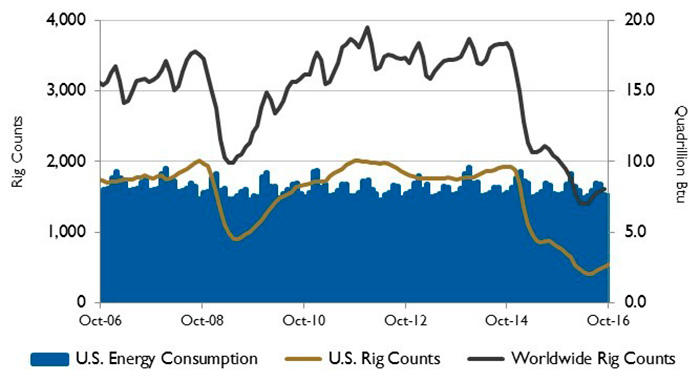 Figure 2. U.S. energy consumption and rig counts. Source: U.S. Energy Information Administration and Baker Hughes Inc.
U.S. gross crude oil imports increased by 7 percent during the first half of the year compared to the first half of 2015, reversing a multiyear trend of decreasing oil imports due to increasing U.S. production. Narrowing price differences between U.S. crude and international prices provided an incentive for refiners to take advantage of lower delivered costs relative to similar domestic crude. Lower overall crude prices contributed to a decline in U.S. crude production from an average of 9.5 million barrels per day in the first half of 2015 to 9 million barrels per day in the first half of this year. The U.S. Energy Information Administration expects annual imports of crude oil to increase on a net basis in 2016 and 2017.
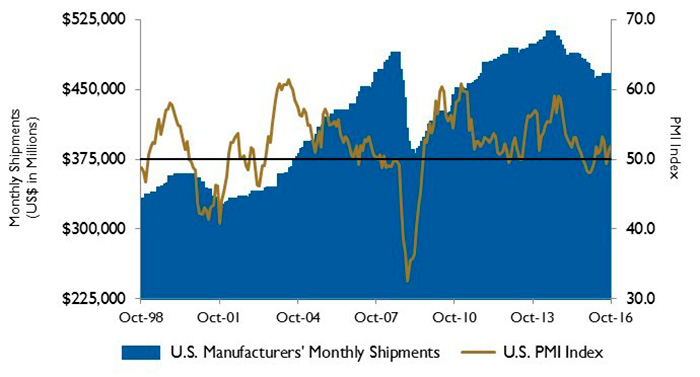 Figure 3. U.S. PMI and manufacturing shipments. Source: Institute for Supply Management Manufacturing Report on Business and U.S. Census Bureau
On Wall Street, the three major U.S. indices were down in October. The Dow Jones Industrial Average was down 0.9 percent, the S&P 500 Index fell 1.9 percent and the NASDAQ Composite fell 2.3 percent. Uncertainties regarding the election’s outcome, mixed corporate earnings results and weaker Chinese trade data all contributed to investor concerns. A pick-up in inflation raised chances of a December interest rate hike by the Federal Reserve Bank.
Reference
- The S&P Return figures are provided by Capital IQ.
These materials were prepared for informational purposes from sources that are believed to be reliable but which could change without notice. Jordan, Knauff & Company and Pumps & Systems shall not in any way be liable for claims relating to these materials and makes no warranties, express or implied, or representations as to their accuracy or completeness or for errors or omissions contained herein. This information is not intended to be construed as tax, legal or investment advice. These materials do not constitute an offer to buy or sell any financial security or participate in any investment offering or deployment of capital.