


The Jordan, Knauff & Company (JKC) Valve Stock Index was up 32.4 percent over the last 12 months, while the S&P 500 Index was up 17.5 percent. The JKC Pump Stock Index rose 36.2 percent for the same period.1
The Institute for Supply Management’s Purchasing Managers’ Index (PMI) increased 1.5 percentage points to reach 56 percent in January, the highest reading since November 2014 and the fifth consecutive month of increases. The production index rose 2 points to 61.4 percent. The employment index increased the most during the month, rising 3.3 points to 56.1 percent. The overall PMI, new orders and production indices registered their highest levels since November 2014.
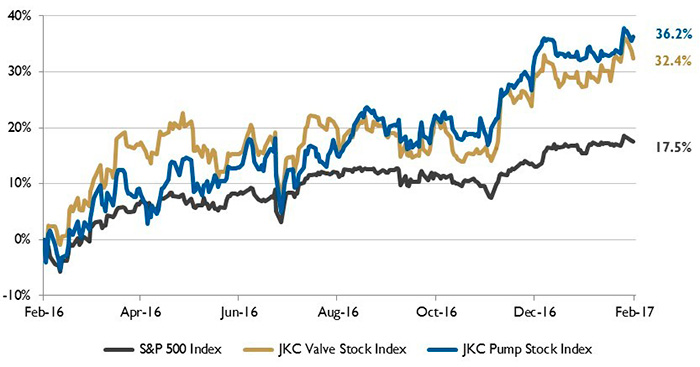 Figure 1. Stock indices from Feb. 1, 2016, to Jan. 31, 2017. Source: Capital IQ and JKC research. Local currency converted to USD using historical spot rates. The JKC Pump and Valve Stock Indices include a select list of publicly traded companies involved in the pump and valve industries weighted by market capitalization.
The Bureau of Labor Statistics reported that nonfarm employment increased by 227,000 jobs in January, well ahead of December’s gain of 157,000 jobs. Retail employment increased by 46,000 jobs over the month, construction added 36,000 and financial services hired 32,000. The manufacturing sector added 5,000 jobs. Average hourly earnings rose 0.1 percent in January, bringing the year-over-year increase to 2.5 percent.
The U.S. Energy Information Administration (EIA) expects U.S. crude oil production to increase from an average of 8.9 million barrels per day in 2016 to an average of 9.3 million barrels per day in 2018 due to gains in the major U.S. tight-oil-producing states of Texas, North Dakota, Oklahoma and New Mexico. Even though U.S. oil production has been declining since mid-2015, production has continued to increase in the Permian region of Texas. Permian production averaged 2 million barrels per day in 2016 and is projected to increase to 2.5 million barrels per day in 2018. Production in the Eagle Ford region in Texas has declined since March 2015 but is expected to begin increasing in the third quarter of this year and continue to increase through 2018. Texas is expected to continue to be the largest oil-producing state through 2018.
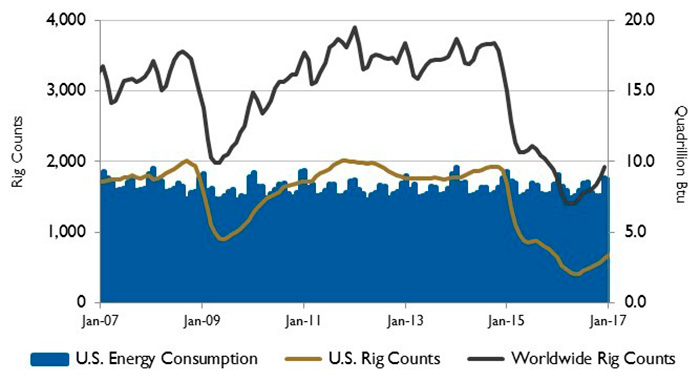 Figure 2. U.S. energy consumption and rig counts. Source: U.S. Energy Information Administration and Baker Hughes Inc.
Global crude oil production and consumption are projected to increase through 2018, with consumption increasing at a faster rate than production, resulting in a tightening of the global market.
On a quarterly basis, consumption is anticipated to be greater than production in the third quarter of this year and next year. Based on annual inventory builds and a lack of a significant draw on existing inventories, the EIA expects oil prices to remain below $60 per barrel through the end of 2018. Due in part to the responsiveness of U.S. tight oil production to rising oil prices late last year, Brent crude oil prices are projected to remain flat this year, averaging $53 per barrel for the year. Prices should slowly increase in 2018, ending the year at $59 per barrel with an average of $56 per barrel for the year.
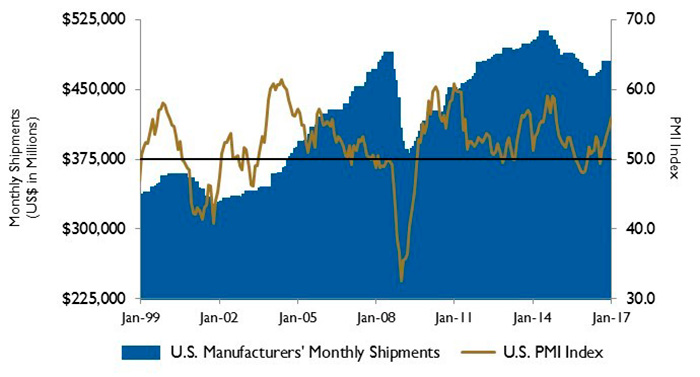 Figure 3. U.S. PMI and manufacturing shipments. Source: Institute for Supply Management Manufacturing Report on Business and U.S. Census Bureau
On Wall Street, the major indices advanced for the month of January for the first time since 2013. The Dow Jones Industrial Average was up 0.5 percent, the S&P 500 Index increased 1.8 percent and the NASDAQ Composite rose 4.3 percent for the month. Projections for stronger economic growth based on the new administration’s statements regarding infrastructure spending, deregulation and tax cuts boosted the markets.
Reference
- The S&P Return figures are provided by Capital IQ.
These materials were prepared for informational purposes from sources that are believed to be reliable but which could change without notice. Jordan, Knauff & Company and Pumps & Systems shall not in any way be liable for claims relating to these materials and makes no warranties, express or implied, or representations as to their accuracy or completeness or for errors or omissions contained herein. This information is not intended to be construed as tax, legal or investment advice. These materials do not constitute an offer to buy or sell any financial security or participate in any investment offering or deployment of capital.