


The Jordan, Knauff & Company (JKC) Valve Stock Index was down 25.8 percent over the last twelve months, while the broader S&P 500 Index was up 9.3 percent. The JKC Pump Stock Index also decreased 20.6 percent for the same time period.1
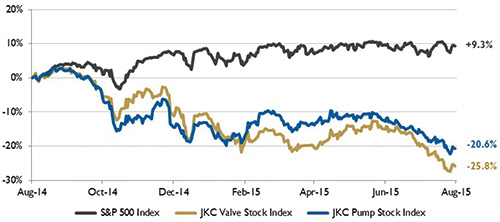 Figure 1. Stock indices from July 1, 2014, to June 30, 2015. Source: Capital IQ and JKC research. Local currency converted to USD using historical spot rates. The JKC Pump and Valve Stock Indices include a select list of publicly traded companies involved in the pump and valve industries weighted by market capitalization.
The Institute for Supply Management’s Purchasing Managers’ Index (PMI) fell to 52.7 percent for the month of July compared to 53.5 percent in June. The New Orders Index rose to 56.5 percent from 56.0 percent, while the Production Index jumped 2.0 percentage points to 56.0 percent. Lower raw materials prices were indicated as the Prices Index fell 5.5 percentage points to 44.0 percent. Inventories of raw materials fell below 50 percent, registering 49.5 percent, a decrease of 3.5 percent from June.
The first estimate by the Bureau of Economic Analysis showed that U.S. gross domestic product (GDP) increased 2.3 percent in the second quarter of the year. The growth includes increases in personal consumption, state and local government spending, residential fixed income and exports. Federal government spending, private inventory investment and nonresidential fixed investment were all lower during the quarter. The report also revised first quarter GDP. Instead of contracting, the economy expanded at a 0.6 percent rate in the first quarter of 2015.
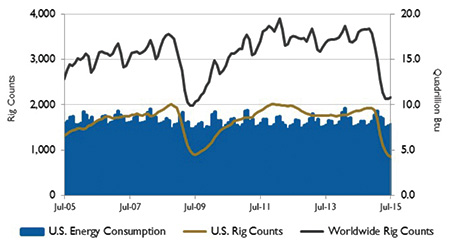 Figure 2. U.S. energy consumption and rig counts. Source: U.S. Energy Information Administration and Baker Hughes Inc.
According to the U.S. Energy Information Administration (EIA), the rolling four-week average of U.S. gross refinery inputs has been above the five-year range every week of this year. Lower crude oil prices and strong demand for petroleum products, mostly gasoline, both in the U.S. and internationally have led to favorable margins. The total amount of gasoline produced in the U.S. is up 2.9 percent through the first five months of the year. Since early April, refinery utilization has consistently been above 90 percent. These record high gross outputs are the result of these high utilization rates and an increase in refinery capacity of 18.0 million barrels
per day as of January 1. U.S. refinery runs typically reach their peak in the second and third quarters of the year.
North Sea Brent crude oil prices averaged $57 per barrel in July and fell to $48 per barrel at the beginning of August. Increasing global liquids inventories, which rose by an estimated 2.3 billion barrels per day through the first seven months of the year compared with an average of 0.6 million barrels per day over the same period last year, helped push oil prices lower. The EIA projects that Brent crude oil prices will average $54 per barrel in 2015 and $59 per barrel in 2016.
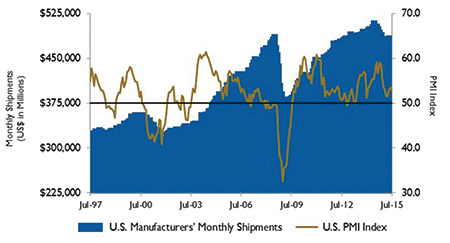 Figure 3. U.S. PMI and manufacturing shipments. Source: Institute for Supply Management Manufacturing Report on Business® and U.S. Census Bureau.
On Wall Street all indices were up for the month of July. The Dow Jones Industrial Average was up 0.4 percent, the S&P 500 Index rose 2.0 percent and the NASDAQ Composite increased 2.9 percent. Despite weak second quarter earnings, the Federal Reserve Bank remains positive about the economy and still expects to increase interest rates “at some point this year.” Overall, economic activity was mixed, with positive gross domestic product numbers and an increase in durable orders, while disappointing data included initial unemployment claims, pending home sales and consumer confidence.
Reference
1. The S&P Return figures are provided by Capital IQ.
These materials were prepared for informational purposes from sources that are believed to be reliable but which could change without notice. Jordan, Knauff & Company and Pumps & Systems shall not in any way be liable for claims relating to these materials and makes no warranties, express or implied, or representations as to their accuracy or completeness or for errors or omissions contained herein. This information is not intended to be construed as tax, legal or investment advice. These materials do not constitute an offer to buy or sell any financial security or participate in any investment offering or deployment of capital.