


The Jordan, Knauff & Company (JKC) Valve Stock Index was up 14.7 percent during the last 12 months, while the broader S&P 500 Index was up 22.5 percent. The JKC Pump Stock Index was up 36.1 percent for the same time period.1
The Institute for Supply Management’s Purchasing Managers’ Index (PMI) increased 1.9 percentage points in February to 53.2 percent from January’s 51.3 percent. The PMI’s average during the past 12 months is 53.8 percent. The New Orders Index was up 3.3 percentage points in January, 54.5 percent in February. The Production Index contracted for the first time since May 2013—down from 54.8 percent in January to 48.2 percent in February.
The U.S. economy added 175,000 jobs in February according to the Department of Labor. During the past three months, job growth has averaged 129,333 jobs per month, well below the average of 194,250 seen in 2013. Professional and business services added 79,000. The manufacturing sector added 6,000 new jobs in February, with the largest gains in transportation equipment (mostly motor vehicles and parts), miscellaneous nondurable goods and machinery.
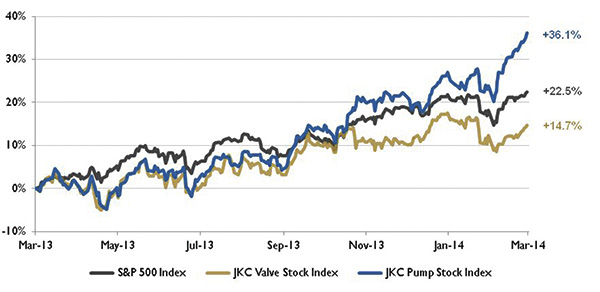 Figure 1. Stock indices from March 1, 2013, to Feb. 28, 2014. Source: Capital IQ and JKC research. Local currency converted to USD using historical spot rates. The JKC Pump and Valve Stock Indices include a select list of publicly-traded companies involved in the pump and valve industries weighted by market capitalization.
According to the U.S. Energy Information Administration (EIA), U.S. total liquid fuels consumption grew by approximately 2.1 percent in 2013. Use of hydrocarbon gas liquids registered the largest increase at 6.2 percent. Gasoline consumption grew by 1.1 percent, the largest increase since 2004 because of growth in highway travel during the second half of 2013. The EIA projects that total liquid fuels consumption in the U.S. will increase 0.2 percent in 2014 and 0.3 percent in 2015, because of increasing transportation demand for distillate fuel oil and industrial demand for hydrocarbon gas liquids.
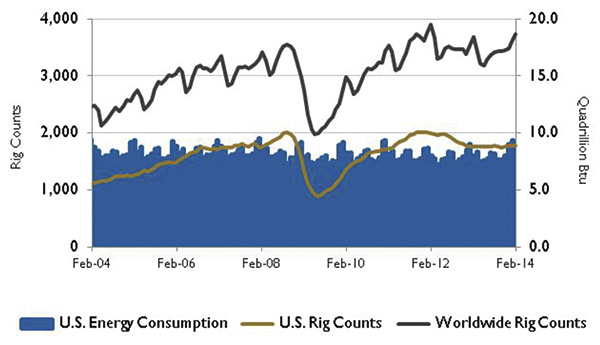 Figure 2. U.S. energy consumption and rig counts. Source: U.S. Energy Information Administration and Baker Hughes Inc.
Driven by rising prosperity in China and India, the EIA projects that world energy consumption will increase by 56 percent during the next three decades. These two countries combined will account for half the increase in the world’s total energy consumption through 2040. Although fossil fuels will continue to supply almost 80 percent of the world’s energy use through 2040, renewable energy and nuclear power are expected to grow faster than fossil fuels, with each increasing by 2.5 percent per year during this period. The liquid fuels share of world consumption is anticipated to fall from 34 percent in 2010 to 28 percent in 2040.
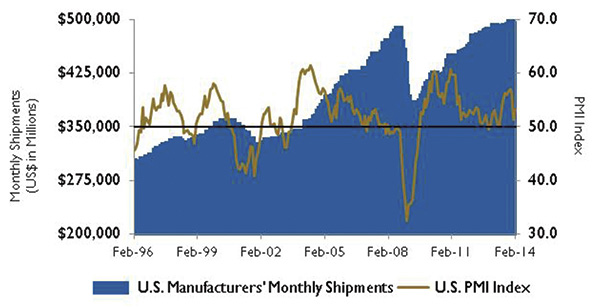 Figure 3. U.S. PMI index and manufacturing shipments. Source: Institute for Supply Management Manufacturing Report on Business® and U.S. Census Bureau.
On Wall Street, the Dow Jones Industrial Average was up 4.0 percent in February, the S&P 500 Index rose 4.3 percent and the NASDAQ Composite Index increased 5.0 percent.
Reference
1. The S&P Return figures are provided by Capital IQ.