


The Jordan, Knauff & Company (JKC) Valve Stock Index was down 22.1 percent over the last 12 months, while the broader S&P 500 Index was down 8.8 percent. The JKC Pump Stock Index also decreased 27.8 percent for the same time period.1
In February, the Institute for Supply Management’s Purchasing Managers’ Index (PMI) increased to 49.5 percent from the January reading of 48.2 percent but remained in contraction territory for the fifth month in a row. The New Orders Index, a forward-looking component of activity, remained positive at 51.5 percent for the second consecutive month. Twelve of 18 industries reported growth in new orders, including textile mills, wood products, furniture and related products, machinery, plastics and petroleum. A chemicals producer noted that U.S. business demand is solid, but international demand is soft.
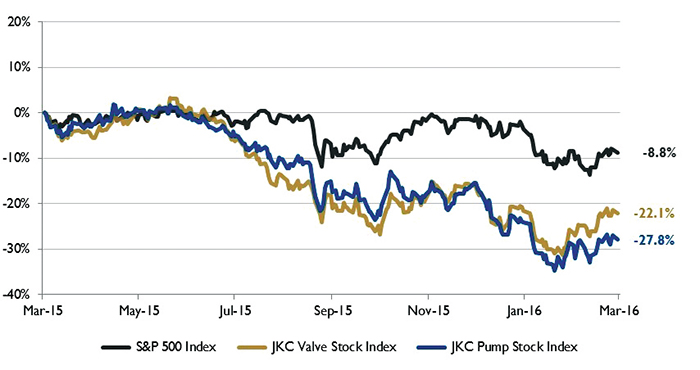 Figure 1. Stock Indices from March 1, 2015, to Feb. 29, 2016. Source: Capital IQ and JKC research. Local currency converted to USD using historical spot rates. The JKC Pump and Valve Stock Indices include a select list of publicly-traded companies involved in the pump and valve industries weighted by market capitalization.
The U.S. Department of Labor reported that the U.S. economy added 242,000 jobs in February and revised January’s nonfarm payroll number up to 172,000. Job gains in December and January were revised up by a combined 30,000 jobs. Sizable job gains were observed in retail, education, health care, and leisure and hospitality, while manufacturing employment lost 16,000 jobs and mining was down 19,000 jobs in February. The unemployment rate remained stable at 4.9 percent. The ongoing pace of solid job growth implies continued support to economic growth from consumer spending. The labor force participation rate has risen 0.5 percentage points since September to 62.9 percent in February.
The number of drilling rigs actively exploring for or developing oil or natural gas in the U.S. averaged 532 in February, according to Baker Hughes Inc. This figure is down from the 654 reported in January and down 816 rigs from the 1,348 reported last February. The worldwide rig count for February was 1,761, down from the 1,891 counted in January and down 1,225 from the 2,986 counted in February 2015.
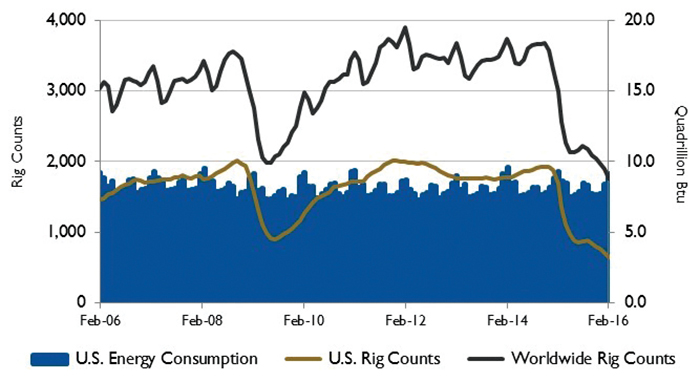 Figure 2. U.S. energy consumption and rig counts. Source: U.S. Energy Information Administration and Baker Hughes Inc.
Along with the decline in active drilling rigs, U.S. oil production has generally declined month to month since April of last year, when it reached a 44-year peak of almost 9.7 million barrels per day, as reported by the U.S. Energy Information Administration. In December, crude oil production averaged 9.3 million barrels per day, which was down 166,000 barrels per day from December 2014. Lower crude oil prices, which have declined more than 70 percent since the summer of 2014, have contributed to the decline in both production and drilling activity.
On Wall Street, the S&P 500 Index decreased 0.4 percent and the NASDAQ Composite fell 1.2 percent in February, while the Dow Jones Industrial Average increased 0.3 percent.
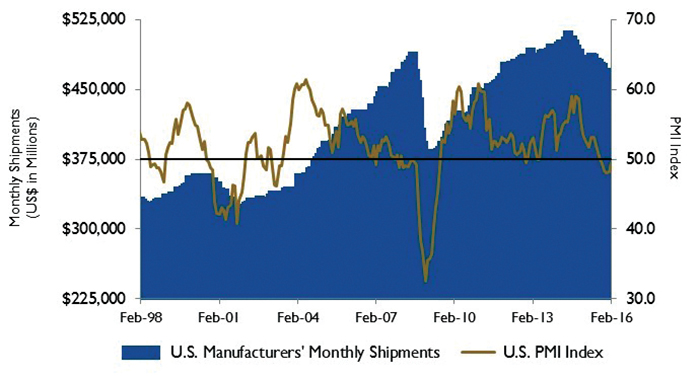 Figure 3. U.S. PMI and manufacturing shipments. Source: Institute for Supply Management Manufacturing Report on Business and U.S. Census Bureau
The indices were down because of mixed economic data, discouraging quarterly reports and the volatility of oil prices following uncertainty regarding production cuts by Russia and Saudi Arabia. Wal-Mart Stores Inc., Cognizant Technology Solutions Corp., Yahoo! Inc. and Exxon Mobil Corporation all reported lower than expected earnings results.
Reference
1. The S&P Return figures are provided by Capital IQ.
These materials were prepared for informational purposes from sources that are believed to be reliable but which could change without notice. Jordan, Knauff & Company and Pumps & Systems shall not in any way be liable for claims relating to these materials and makes no warranties, express or implied, or representations as to their accuracy or completeness or for errors or omissions contained herein. This information is not intended to be construed as tax, legal or investment advice. These materials do not constitute an offer to buy or sell any financial security or participate in any investment offering or deployment of capital.