


The Jordan, Knauff & Company (JKC) Valve Stock Index was up 15.0 percent during the last 12 months, while the broader S&P 500 Index was up 19.8 percent. The JKC Pump Stock Index was up 33.8 percent for the same time period.1
The Institute for Supply Management’s Purchasing Managers’ Index (PMI) increased 0.5 percentage points over February’s level to reach 53.7 percent in March. The New Orders Index increased 0.6 points to 55.1 percent. The Production Index registered a substantial increase of 7.7 points more than February’s reading of 48.2 percent, representing the largest month-over-month increase in production since June 2009. Order backlog also had a healthy 5.5 percent increase.
The Department of Labor reported that total nonfarm employment rose by 192,000 jobs in March. January and February employment numbers were revised up by a total of 37,000 jobs increasing the number of private-sector jobs to a record 116.09 million, finally replacing the 8.8 million positions lost during the recession. Employment in government was unchanged during the month. A decline of 9,000 jobs in the federal government was offset by an increase of 8,000 jobs in local government. Federal government employment has decreased by 85,000 jobs during the past year.
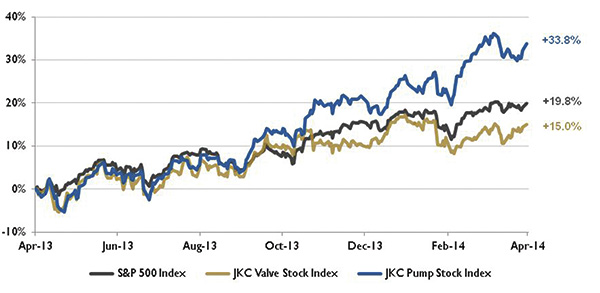 Figure 1. Stock indices from April 1, 2013, to March 31, 2014. Source: Capital IQ and JKC research. Local currency converted to USD using historical spot rates. The JKC Pump and Valve Stock Indices include a select list of publicly-traded companies involved in the pump and valve industries weighted by market capitalization.
According to the U.S. Energy Information Administration (EIA), total U.S. crude oil production grew 15 percent last year to 7.4 million barrels per day. Texas and North Dakota led the growth. Since 2010, North Dakota’s crude oil output has increased 177 percent, and Texas’s has increased by 119 percent. Five states and the Gulf of Mexico supplied more than 80 percent of production in 2013. Texas provided almost 35 percent. The offshore Gulf of Mexico produced 17 percent, followed by North Dakota at 12 percent, California and Alaska at almost 7 percent each and Oklahoma at 4 percent.
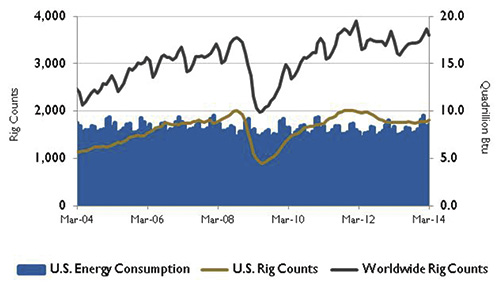 Figure 2. U.S. energy consumption and rig counts. Source: U.S. Energy Information Administration and Baker Hughes Inc.
The West Texas Intermediate (WTI) crude oil spot price increased to an average of $101 per barrel in February and March from an average of $95 per barrel in January. The EIA expects WTI crude oil prices to average $96 per barrel in 2014.
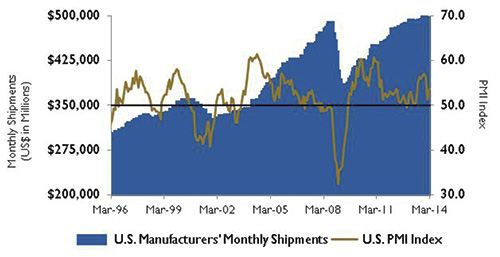 Figure 3. U.S. PMI index and manufacturing shipments. Source: Institute for Supply Management Manufacturing Report on Business® and U.S. Census Bureau.
 On Wall Street, the Dow Jones Industrial Average was up 0.8 percent in March. The S&P 500 Index rose 0.7 percent while the NASDAQ Composite Index decreased 2.5 percent, its worst monthly performance since October 2012. During the first quarter 2014, the S&P 500 and the NASDAQ Composite gained 1.3 percent and 0.5 percent, respectively. However, the Dow Jones Industrial Average was down 0.7 percent.
Reference
1 The S&P Return figures are provided by Capital IQ.
These materials were prepared for informational purposes from sources that are believed to be reliable but which could change without notice. Jordan, Knauff & Company and Pumps & Systems shall not in any way be liable for claims relating to these materials and makes no warranties, express or implied, or representations as to their accuracy or completeness or for errors or omissions contained herein. This information is not intended to be construed as tax, legal or investment advice. These materials do not constitute an offer to buy or sell any financial security or participate in any investment offering or deployment of capital.