


The Jordan, Knauff & Company (JKC) Valve Stock Index was up 16.3 percent over the last 12 months, keeping pace with the broader S&P 500 Index, up 16.8 percent. The JKC Pump Stock Index was down 7 percent for the same time period.1
The Institute for Supply Management’s Purchasing Managers Index (PMI) registered 49.6 percent, a decrease of 0.2 percentage points from July’s reading of 49.8 percent, indicating contraction in the manufacturing sector for the third consecutive month. This is the lowest level for the PMI since July 2009. With a reading of 47.1 percent, the New Orders Index also signaled contraction for the third consecutive month. In addition, for the first time since May 2009, the Production Index fell into contraction territory. Of the 18 industries tracked, eight remain in expansion mode, an indication that the weakness is becoming fairly widespread. According to the ISM Report on Business in August 2012, supply executives commented on slowing sales and political and economic uncertainties.
New orders for manufactured goods, up two of the last three months, increased 2.8 percent to $478.6 billion in July, the U.S. Census Bureau reported. This followed a 0.5 percent decrease in June. Excluding transportation, new orders increased 0.7 percent. Shipments, up two of the last three months, increased 2 percent to $478.8 billion.
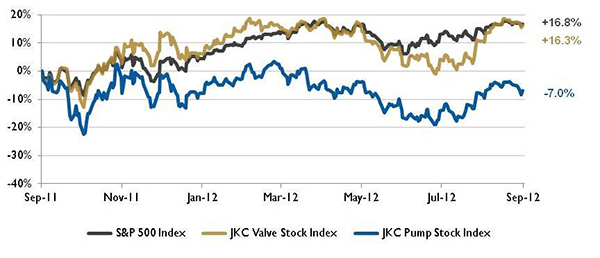 Source: Capital IQ and JKC research. Local currency converted to USD using historical spot rates. The JKC Pump and Valve Stock Indices include a select list of publicly-traded companies involved in the pump and valve industries weighted by market capitalization.
According to the Department of Labor, the economy added 96,000 jobs in August, much less than expected and down from 141,000 jobs in July. Gains were reported by professional and business services, education and health, as well as leisure and hospitality. However, the manufacturing sector lost 15,000 jobs, primarily at auto and metals firms. The labor force participation rate fell to 63.5 percent, the lowest rate since September 1981. With fewer individuals in the labor force, the unemployment rate dropped to 8.1 percent.
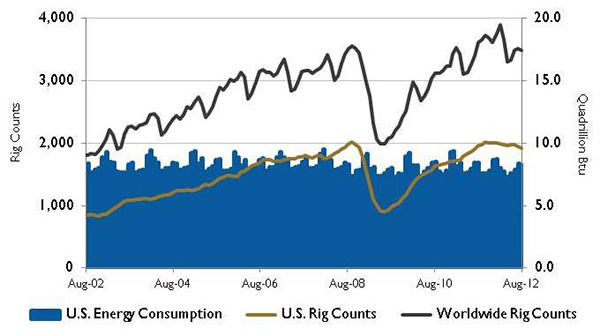 Source: U.S. Energy Information Administration and Baker Hughes Inc.
 The share of U.S. total liquid fuel consumption met by imports of both crude oil and products has been falling since peaking at more than 60 percent in 2005. In 2011, it averaged 45 percent, down from 49 percent in 2010. The Energy Information Administration expects that the total net import share of consumption will continue to decline to 41 percent in 2012 and to 39 percent in 2013 because of the substantial increases in domestic crude oil production.2
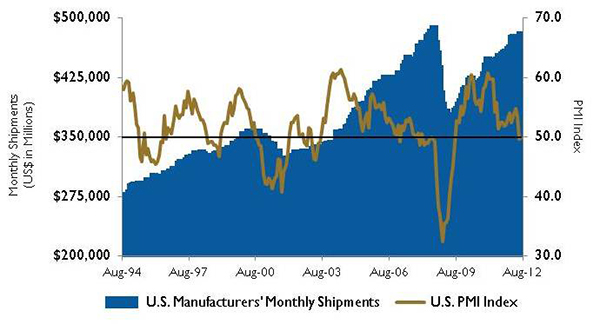 Source: Institute for Supply Management Manufacturing Report on Business® and U.S. Census Bureau.
References
- S&P Capital IQ.
- U.S. Energy Information Administration. Short Term Energy Outlook September 2012.