


Pumps have been widely dispersed throughout the globe and used to sustain record economic development. The pressure on pump manufacturers during the next decade will only be stronger, as demand will be high and competition strong. Most pump buyers and suppliers have a strong notion of the possible efficiency that might be available by referring to reference curves, some as old as the early Worthington curve, or any number of more contemporary variants
The pumps that are manufactured and sold during the next decade will have performance close to these venerable curves. Of course, small gains in efficiency will be eked out, often by the use of optimization search methods such as those shown in Japikse (2002) or Japikse and Platt (2004) or Anderson (2009). These are worthy methods and are already routinely used in certain advanced groups. However, another source of significant performance gain is often overlooked—simply redesigning existing products for higher efficiency and better stability.
A Problem Impeller
One example is a commercial pump bought for a project. This pump’s impeller is shown in Figure 1 with a modern redesign in Figure 2. This original pump failed to meet both the efficiency (-4 percent) and the head rise (-15 percent) specified by the manufacturer. Additionally, it was unstable, and testing revealed considerable variance in performance with time. Vibration and noise problems were also noted.
Initial operation of the pump required adding an inlet flow divider to stabilize the flow. This worked adequately. Due to the low overall performance, it was decided to examine means of improving the performance while holding the original design objectives.
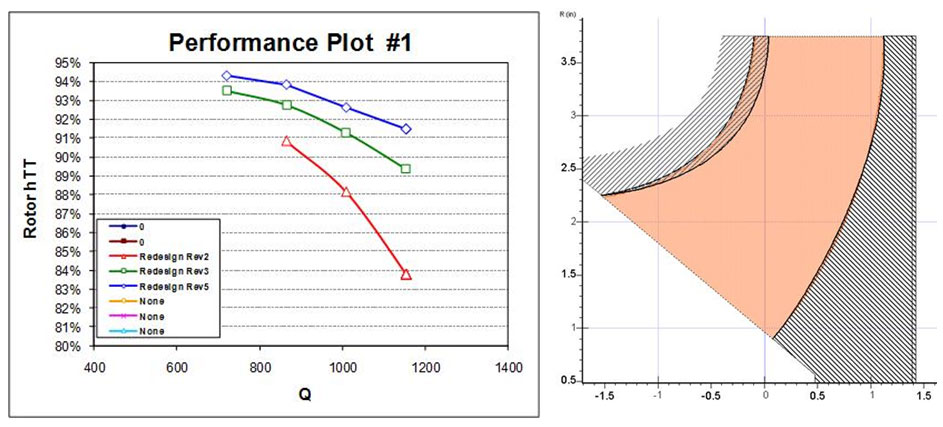
Initial trial calculations were conducted using flow analysis software for an evaluation. Key results are shown in Figure 1. The flow analysis (pbCFDR was used)matched the impeller efficiency (3a) and head rise (3b) over a good portion of the flow curve. This evaluation was for the impeller only and did not include the volute.
 |
| Image 1. OEM Impeller |
 |
| Image 2. Redesigned Impeller |
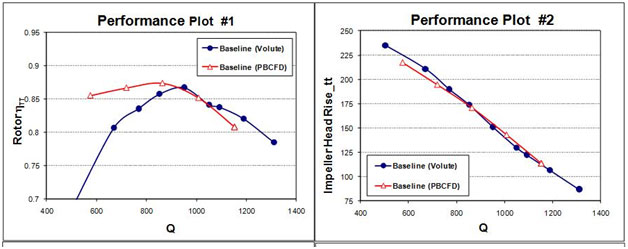 |
Figure 1. Measured efficiency (blue) with flow analysis comparison (red) for OEM impeller (3a – efficiency and 3b – head rise)
Impeller Redesign
The redesign required attention to several issues. Meanline calculations revealed that the inlet eye was not optimum for this application. Blade loading calculations revealed that improved blade shapes would be possible. Additionally, it was clear that a sensitivity study for the exit blade height should be conducted, since the original equipment manufacturer (OEM) impeller used shallow exit blade angles (15-degree shroud and 10-degree hub). Classical guidance in this area is weak.
Figure 4 shows the revised inlet and the revised blade angles used in this study. The eye radii were reduced, and new blade angles were selected to control hydrodynamic loading, with exit blade angles of a 15-degree shroud and 20-degree hub. These are low angles, but they are more realistic for a high performance design.
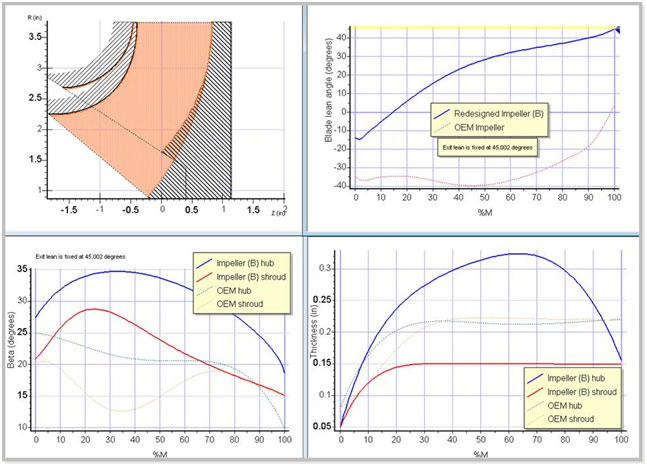 |
| Figure 2. New contours and blade angles for improved performance |
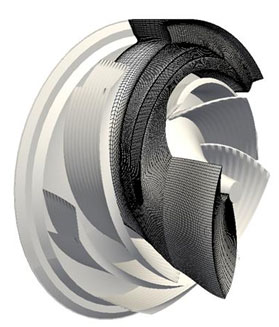
The revised blade angles were developed in a 3D geometric design program using classical through-flow calculations and then confirmed with detailed flow analysis studies as useful examples (see Figures 3 and 4). Figure 3a shows a well-defined computational grid of about 650,000 nodes with a Y+ of 32. The Spalart-Allmaras turbulence model was used in the RANS solver. Figure 3b illustrates a key result: no recirculation was found anywhere in the redesign flow field except in the shroud clearance gap, which is to be expected.
 |
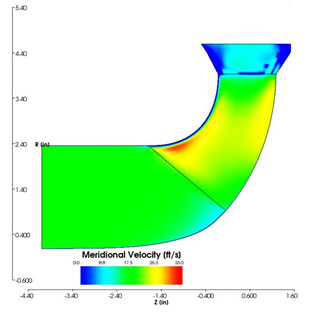 |
| Figure 3a. Sample impeller O-H grid | Figure 3b. Sample flow field showing absence of backflow |
Figure 4 illustrates computational fluid dynamics (CFD) usage to study specific issues. In this example, tip depth was studied to find the best head and efficiency. The results were surprising because both head and efficiency rose with further tip width increases beyond that of the OEM design and beyond any of the standard reference guidelines. This was particularly surprising since the OEM stage had considerable instability associated with it.
 |
| Figure 4. Study of impeller exit showing increased efficiency; also, increased head was found (not shown) |
The final improved design, therefore, had an improved inlet eye, blade shapes, blade exit angles and exit width. The same volute was used for convenience.
The revised design (see Image 2) was machined and tested in its final machined state. The test configuration (see Figure 5) and precise measurements of head and efficiency were conducted. The OEM volute is evident in the photo in Figure 5.
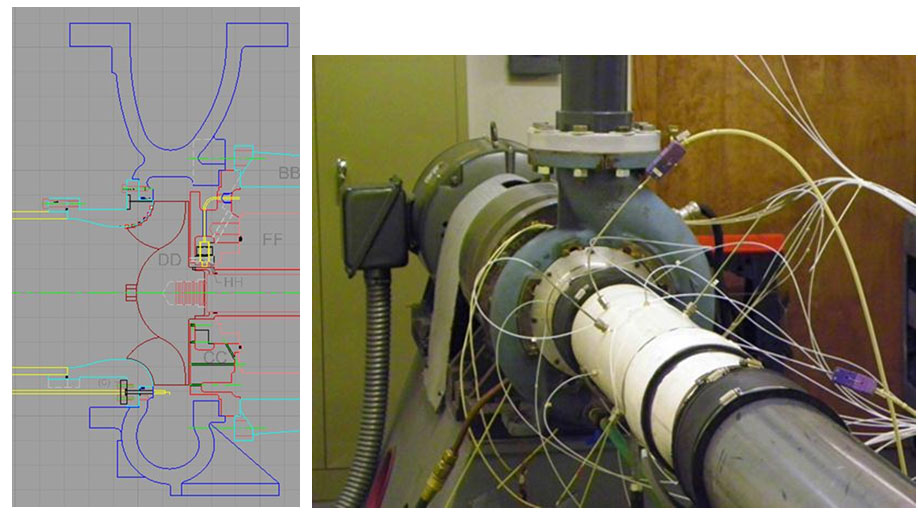 |
| Figure 5. The test rig cross section and full laboratory setup with instrumentation |
The Results
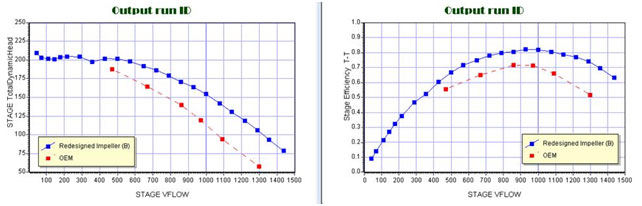
Laboratory measurements were used for further model development and design validation. Figure 6 shows the measured head and efficiency of the new stage compared to the OEM stage and tested in the same facility. Improvements of 6 to 7 percent of efficiency and at least 40 feet of head were achieved, while using the same volute. Of equal significance is that the instability disappeared without using special treatment (inlet divider) to suppress unwanted effects.
 |
| Figure 6. New stage measurements compared to original - blue, redesign and red, OEM |
Comparing this redesigned stage against the original intention of the OEM stage is also instructive (see Figure 7). It checks out closely with standard reference curve expectations for a stage today. Exceptional agreement was achieved. The head curve is completely healed and the efficiency is now about 2 to 5 points above the originally anticipated and current state-of-the-art values.
 |
| Figure 7. Comparison of new stage performance to OEM's stated intent - gains above current state of the art are evident |
Two more points are important from this study. First, the design tools worked well for this development. The CFD results are compared to measured results on a totally blind basis (see Figure 8). The green lines were predicted before the impeller was built, and the results are shown as they came from the laboratory. Differences between the two are slight and have rational explanations.
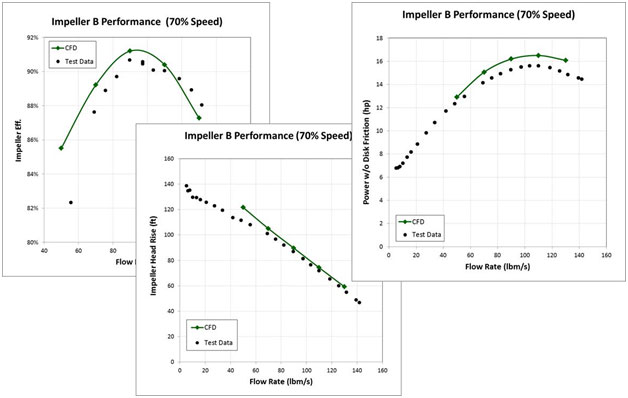 |
| Figure 8. Excellent agreement between laboratory and predicted performance |
The second concluding point is that the OEM volute now performs better than when tested with the OEM impeller. A cleaner flow field leaves the impeller, and the volute shows reduced losses and higher static pressure gain, especially at higher flow rates.
This redesign study illustrates some key points:
- A lot of room is available for performance gain, especially when one carefully studies the range of pumps currently in use. Some of these should be revamped before any future usage.
- Some performance gains above today’s state-of-the-art expectations can be made, as was also shown in this real-life case.
This article did not concentrate on new pump design challenges. These, of course, demand highly flexible design tools with thorough pedigree and validation.
Acknowledgements
The author wishes to acknowledge team members who contributed strongly to this effort. The author led a team of colleagues through this activity. Robert Pelton served as one of the hydrodynamicists, and Andron Morton led the laboratory evaluation efforts. Their work was valuable for reaching the conclusions presented in this study.
References
- Japikse, David, “Expedited Agile System Design and Redesign Approach for Industrial Pumps,” Proceedings of NRC/ASME: Symposium on Valve and Pump Testing, Washington, D.C., July 15 – 18, 2002.
- Japikse, David, and Platt, Michael J., “Optimization in Component Design and Redesign,” 10th Int'l Symposium on Transport Phenomena and Dynamics of Rotating Machinery (ISROMAC-10), Honolulu, Hawaii, March 7 – 11, 2004.
- Anderson, Mark R., “Optimization of Turbomachinery – Validation Against Experimental Results,” CDK Nové Energo, 2009 – Current Trends in Design and Computation of Turbomachinery, June 2 – 4, 2009.