Compression packings have suffered from a reputation of being an old-fashioned technology unsuited to modern industrial processes. In the case of rotating equipment, they are largely superseded by mechanical seals. In particular, many believe packings are inefficient because of high frictional losses. Much of this perception is based on outdated products and not on modern types that use sophisticated synthetic yarns combined with complex lubricants. This article describes the development of a straightforward test procedure for compression packings used in rotary applications. The procedure was used to study the frictional characteristics of several packing types in comparison with various mechanical seals using a test rig specifically designed for the purpose. The results from the friction testing on a number of packing types and mechanical seals will also be discussed. These results call into question the theoretical methods currently used to calculate packing friction.
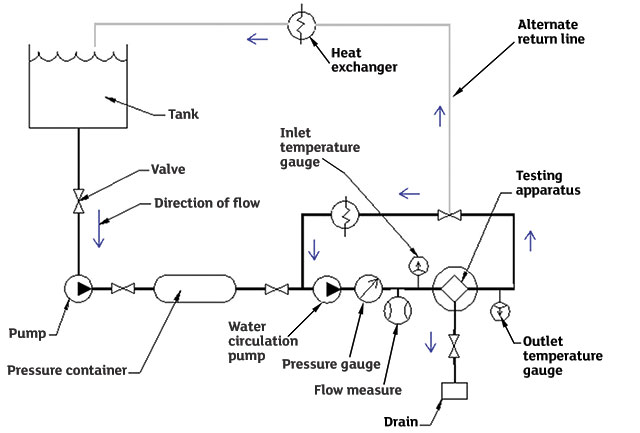 Figure 1. Typical test arrangement (Images and graphics courtesy of FSA)
Test Procedure Development
As early as 2004, the European Sealing Association (ESA) along with its U.S. counterpart, the Fluid Sealing Association (FSA), formed a joint task force to develop a realistic, performance-based test method for compression packings used in rotary applications. The driving force for this project was to enable manufacturers to publish true comparative data on packing performance and allow end users to better differentiate between products when making selections for their applications. The specification was developed through a number of iterations. At each stage, the validity, accuracy and repeatability were tested using "round-robin" tests. Each member company tested the same product from a single source, and the results were compared. Any deviations from consistency were discussed and the specification refined for the next validation round. To maintain impartiality, all of the test results were submitted to an independent body for analysis—French research organization Centre Technique des Industries M\'e9caniques (CETIM), who also carried out their own tests in each round. Figure 1 shows a typical test setup. The first drafts of the specification allowed test conditions that reflected those commonly encountered in field applications but with water as the test medium. The following parameters were to be measured and recorded at specified intervals during each test run after the break-in period and at the end of the test:- Total leakage (milliliters)
- Leak rate (milliliters per hour)
- Gland temperature (degrees Celsius)
- Number of gland adjustments
- Amount of each adjustment (millimeters)
- Normalized power consumption (watts per millimeter squared)
- L1 = less than or equal to 5 milliliters per minute (ml/min)
- L2 = less than or equal to 15 ml/min
- L3 = less than or equal to 30 ml/min
Power Consumption
While the final test procedure produced good correlation of results in terms of packing leakage, temperature and post-test packing condition, the one performance aspect that continued to cause debate was frictional level and power consumption. Throughout the round-robin test program the results reported for frictional torque or absorbed power showed significant variability, partly because of the different methods used to measure it. This uncertainty about packing friction is concerning, because the generally accepted wisdom is that packings are inefficient in terms of power consumption. But little research has been conducted on the more sophisticated products currently available that use exfoliated graphite, ePTFE, aramid and other synthetic yarns and modern lubricant systems. To obtain definitive information on packing friction, the joint ESA/FSA Technical Task Force commissioned CETIM to carry out a follow-up project. It consists of the design and manufacture of a dedicated test rig to carry out testing in accordance with the procedure, including highly accurate systems to directly measure the frictional force of the packing alone.Test Rig
The test rig is designed to test both compression packings and mechanical seals so direct comparison can be made under the same conditions (see Image 1, page 98). A torque meter is used to record the mechanical seal or packing friction on the shaft. Measurements of torque, temperature and leakage levels are recorded, and the instrumentation permits continuous monitoring of all parameters throughout the test.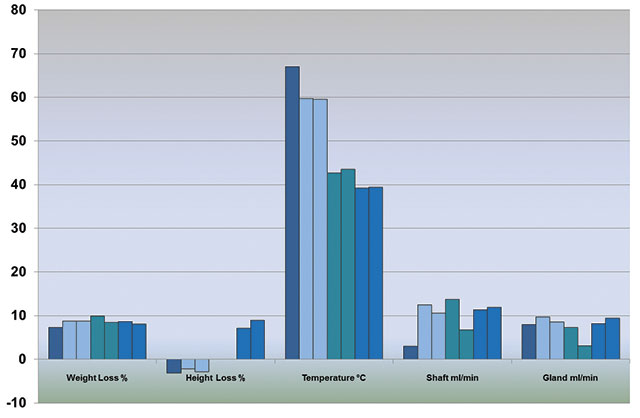 Figure 2. Results from round-robin 5
Initial Testing
After initial trials to validate the equipment functionality and accuracy of the monitoring devices, the first tests were carried out on the same graphite/ePTFE packing that had been widely used during the earlier test program. Testing was conducted at different rotational speeds and pressures, with varying target leak rates. For direct comparison, a typical unitized, single-spring elastomer bellows mechanical seal was also tested under a range of conditions. It is an unbalanced mechanical seal with carbon graphite versus chromium oxide seal faces. The results of these tests are shown graphically in Figure 3a. The measured torque is plotted for different water pressures, in the case of the packing with the associated shaft leak. During these tests, the gland leak rate was of the same order of magnitude as that of the shaft. These results were unexpected. The figures for packing were much lower than predicted and were of the same order of magnitude as, and generally lower than, the mechanical seal. Of course, a degree of leakage must be tolerated when using packings, and the lubrication afforded by the leaking fluid will reduce the friction. But even when the leak rate is extremely low, as in the case at 6 bar and 1500 rpm, the friction recorded was the same as that for the mechanical seal at a lower pressure. Rigorous checks were carried out to ensure the accuracy of the results. In particular, the measurement range of the torque meter was revised to ensure accuracy at these much lower torque levels, and it was verified that the torque levels measured for mechanical seals were generally in line with the manufacturer's published data.Further Tests
A further series of tests was carried out on two other packing types and four mechanical seal variants. The packings were a lubricated natural ramie fiber, which would normally be used where higher leakage would be acceptable, and a synthetic aramid yarn packing. The mechanical seals were one unbalanced and two balanced component seals and a cartridge balanced seal. They were chosen to represent a cross section of commonly used designs. These featured carbon graphite versus silicon carbide seal faces. This face combination is typically chosen for its low coefficient of friction. The designs had different balance ratios, and two had a composite narrow seal face and the other two had a monolithic narrow seal face. All tests in this sequence were carried out at 6 bar pressure. The comparative results are shown in Figure 3b. Some of the results for the mechanical seals were unexpected. The unbalanced mechanical seal showed lower torque than the balanced O-ring pusher seal. The difference can most likely be explained by the fact that the face profiles are different for the composite seal face of the balanced seal than the monolithic design of the unbalanced seal. Typical thermal deflections are different for these variations in design. The composite faces tend to have a divergent profile with outside contact, while the monolithic face tends to have a convergent profile with good fluid penetration between the faces. The pressure drop between the seal faces is different, leading to higher effective hydraulic closing forces for the outside contact than for the inside contact. Different spring loads for the designs, which are difficult to set accurately in component seals, would also have a significant impact on contact pressure. This illustrates two major points. First, specific designs have specific characteristics, and broad classifications are not sufficient to evaluate the power consumption of one type of design. Second, the pressure drop between the sealing interface is critical in determining the actual power consumption of the sealing device. This should be considered with packing and mechanical seals. The packing friction compares favorably with all of the mechanical seal variants. These unexpected results have led to a reconsideration of the traditional methods for calculating packing friction..jpg) Image 1. Friction test rig
Image 1. Friction test rigTheoretical Considerations
The formula that has long been used to calculate power consumption from compression packing systems is as follows: P= Pp x RPM x D x µ x Ap x F Where P = Power (HP or kilowatts, depending on units used) PP = sealed pressure RPM = rotational speed D = shaft diameter µ = coefficient of friction between the packing and the shaft Ap = packing contact area F = factor, depending on units used This formula is similar to the one used for mechanical seals, which has been shown to give a good approximation to power consumption levels. Recognized approximations in the packing formula are that it does not take account of lubricant levels, actual packing compression, type of liquid sealed, viscosity or temperature. But it can provide a figure for the amount of energy consumed by the packing. It tends to give power consumption levels that are approximately 10 times that of a balanced mechanical seal used under the same conditions. Test results show that the approximations in the formula are not sufficient to explain the deviations from the calculated values. The differences in calculated results from the test measurements reported here vary by factors from 25 to 100 times. While more work is planned, the conventional wisdom contained assumptions that are not verified through the experiments. Thus, the use of sealed pressure as the contact pressure for the packing along its entire axial length must be revised. A pressure drop coefficient of 0.2 gives much better correlation of calculated to testing results. The coefficient of friction must also be re-evaluated when current advanced synthetic fiber materials are used. For example, a coefficient of friction value of 0.03 for ePTFE/Graphite packing is more in agreement with testing results than the traditional value of 0.17. Other variables must also be considered, such as shaft speed and size as well as leakage levels because they have a direct impact on power consumption.Further Work
Some further test work is planned on other packing types. The major thrust of this work is to develop a mathematical model that will provide an accurate tool for the calculation of packing power consumption. A revised formula will be finalized once testing is completed.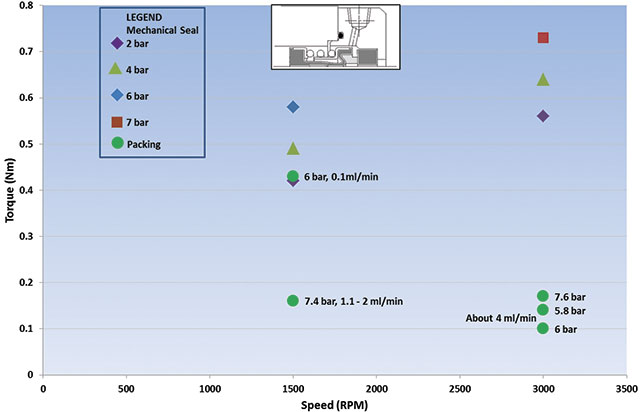 Figure 3a. Initial friction tests for mechanical seal and graphite/ePTFE packing
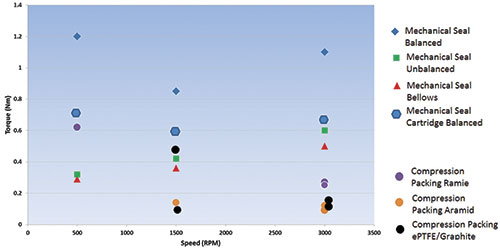 Figure 3b. Tests at 6 bar