

This article will discuss the 2025 mergers and acquisition (M&A) activity in the fluid handling industry (FHI). It will also provide an outlook for industry M&A in 2026.
This report is focused on M&A transactions involving companies that manufacture, distribute and/or provide services for dynamic (rotary or reciprocating) equipment—and related products—that enable industries to move fluids as a key part of their value-added processes.
Deal Activity
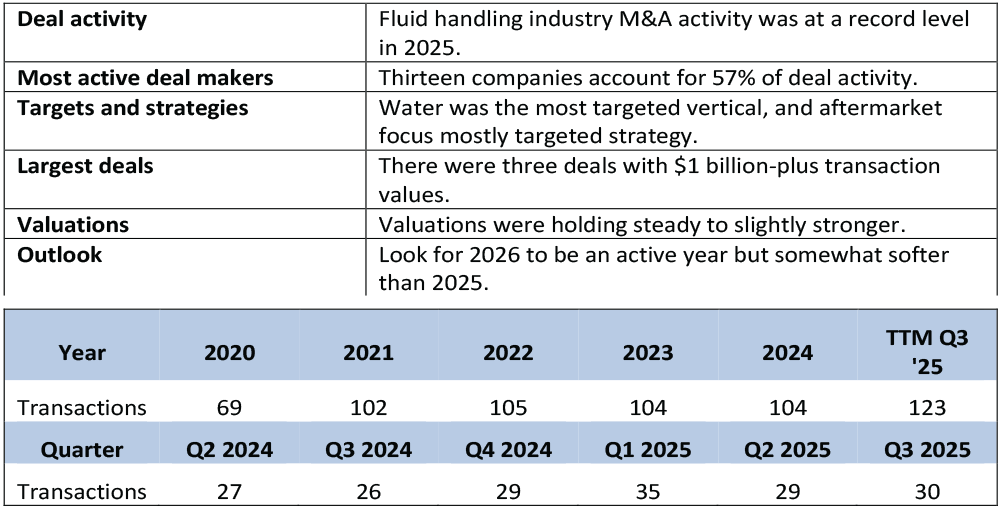
The fluid handling industry saw record deal activity in the trailing twelve months (TTM) ending Q3 2025, driven by strong demand for quality acquisitions for a variety of strategic reasons that are discussed below. There were relatively favorable conditions, including lower cost and improved capital availability, and a positive growth outlook also contributed to this momentum.
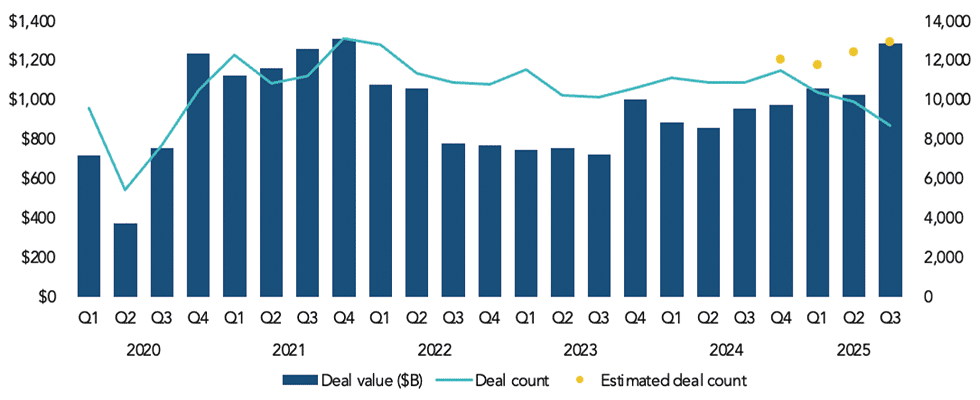
When we look at the trend of overall global M&A activity, as measured by deal count (the yellow dot extension of the blue line in Image 2) and deal value as shown in the bar graph in Image 2, the overall deal activity is getting back to the previous high levels of 2021, while the trailing 12-month activity level in the fluid handling industry is substantially above the 2021 industry activity level. This indicates that the current level of M&A activity in the fluid handling industry is stronger than the overall global M&A activity.
Most active deal makers
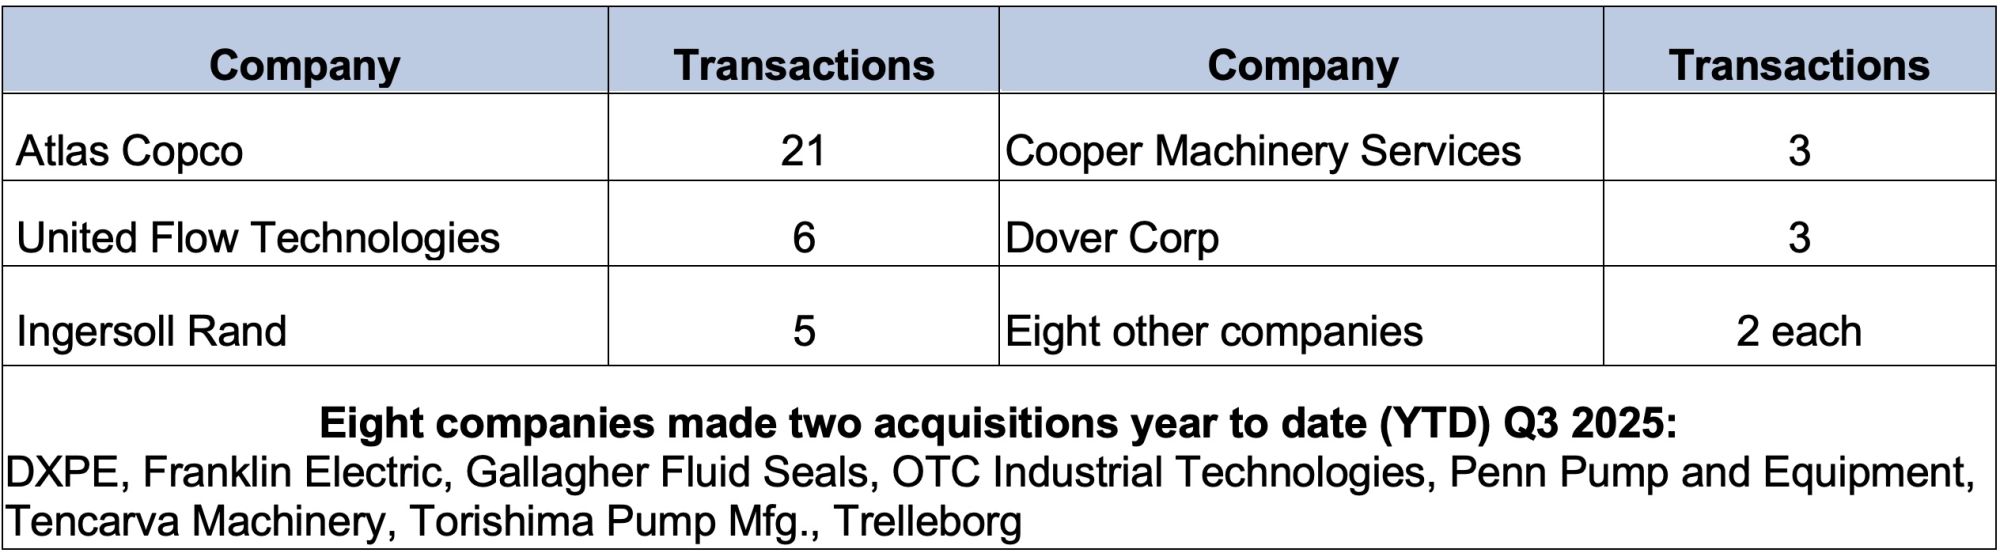
While fluid handling industry M&A is at a strong level, the activity is concentrated in relatively few companies in any given period. Through Q3 2025, 13 companies accounted for 57% of the FHI M&A deal activity.
Targets & Strategies
Targets
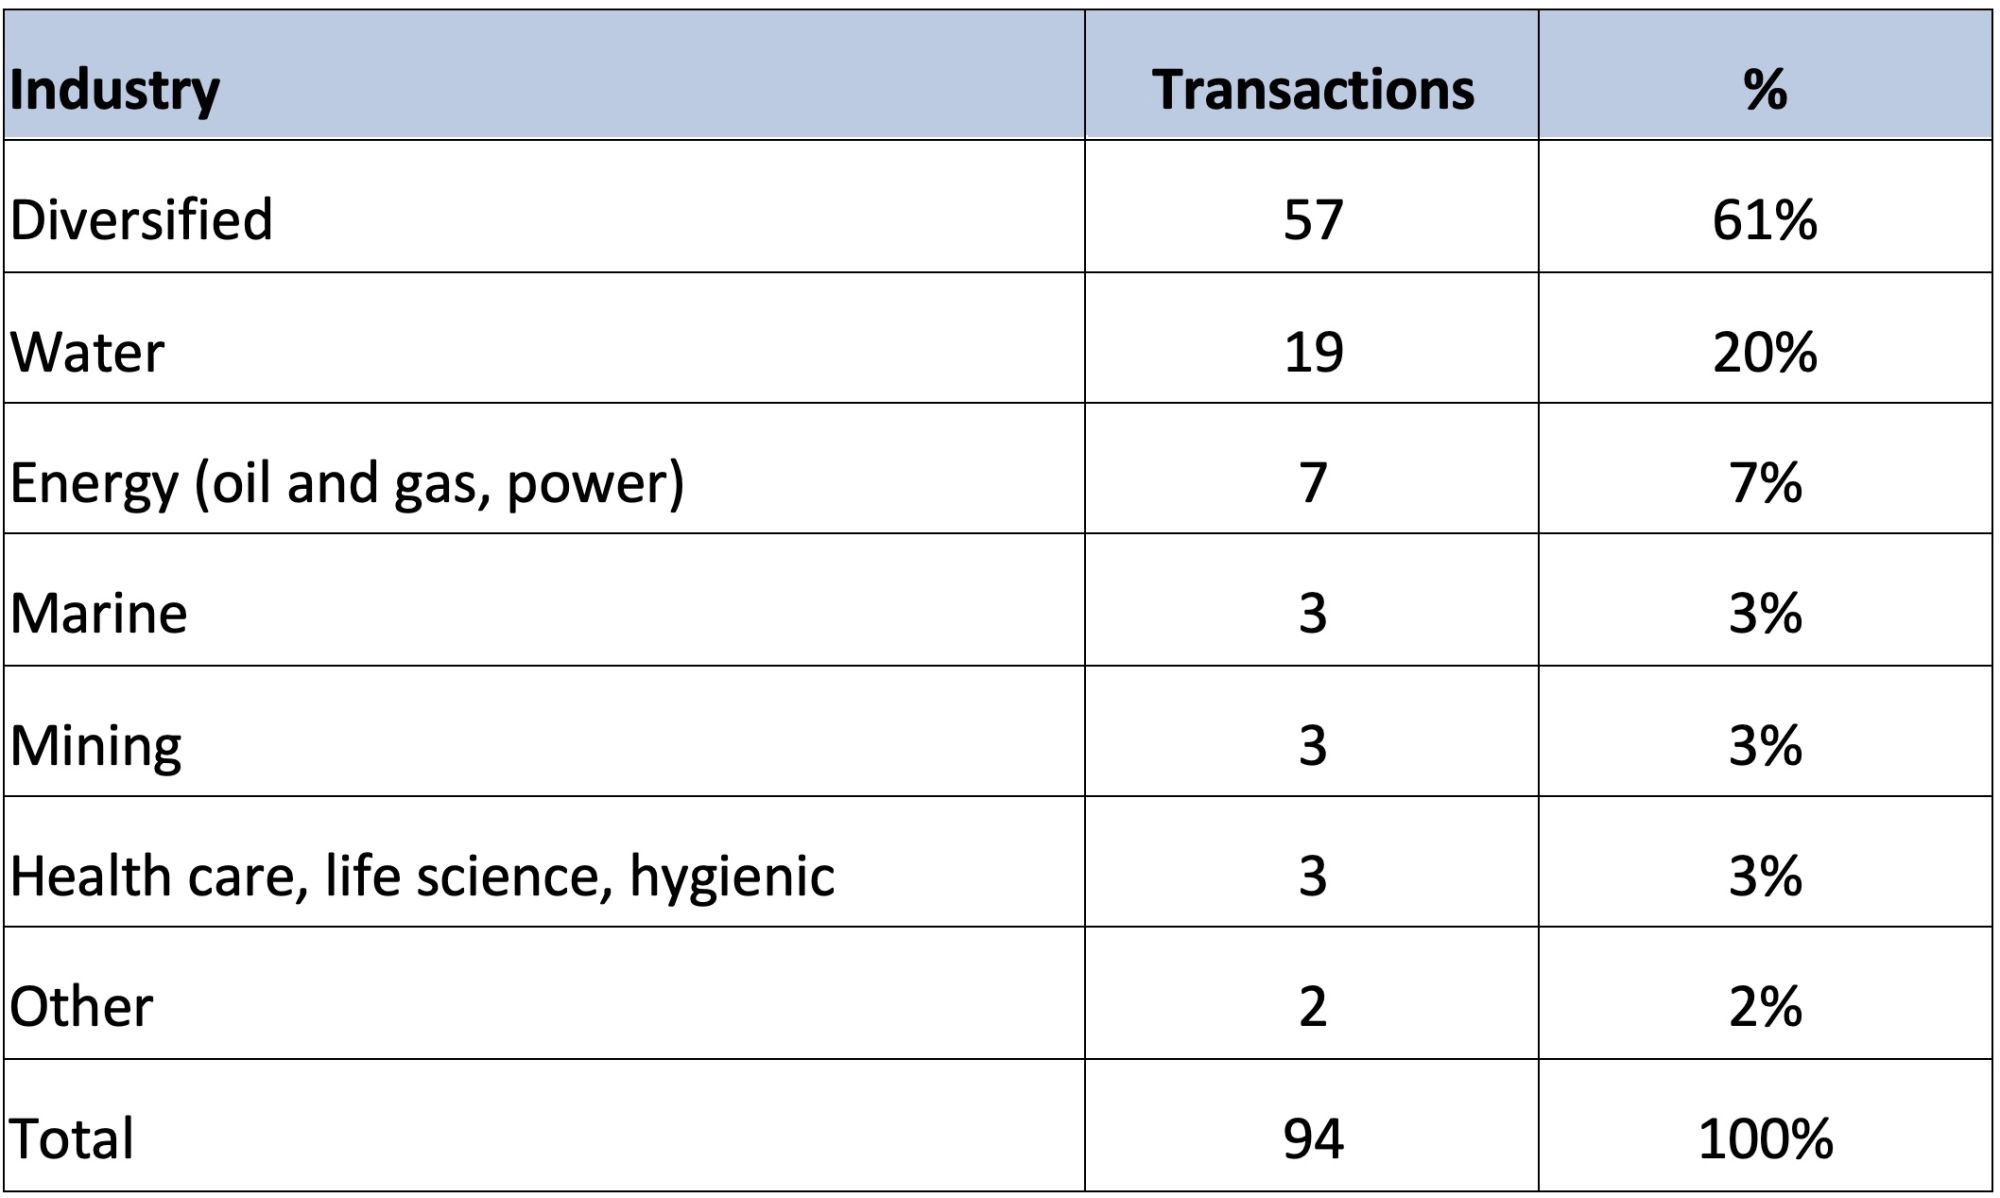
In 2025, some change was seen in the mix of target industries:
- For 2024, the diversified category was 71%. (“Diversified” means the target company serves multiple end-user market sectors.)
- Water was the target for 15% of the deal activity in 2024.
- Energy was about the same percentage in 2024 at 6%.
- Mining and marine targets are being seen more consistently.
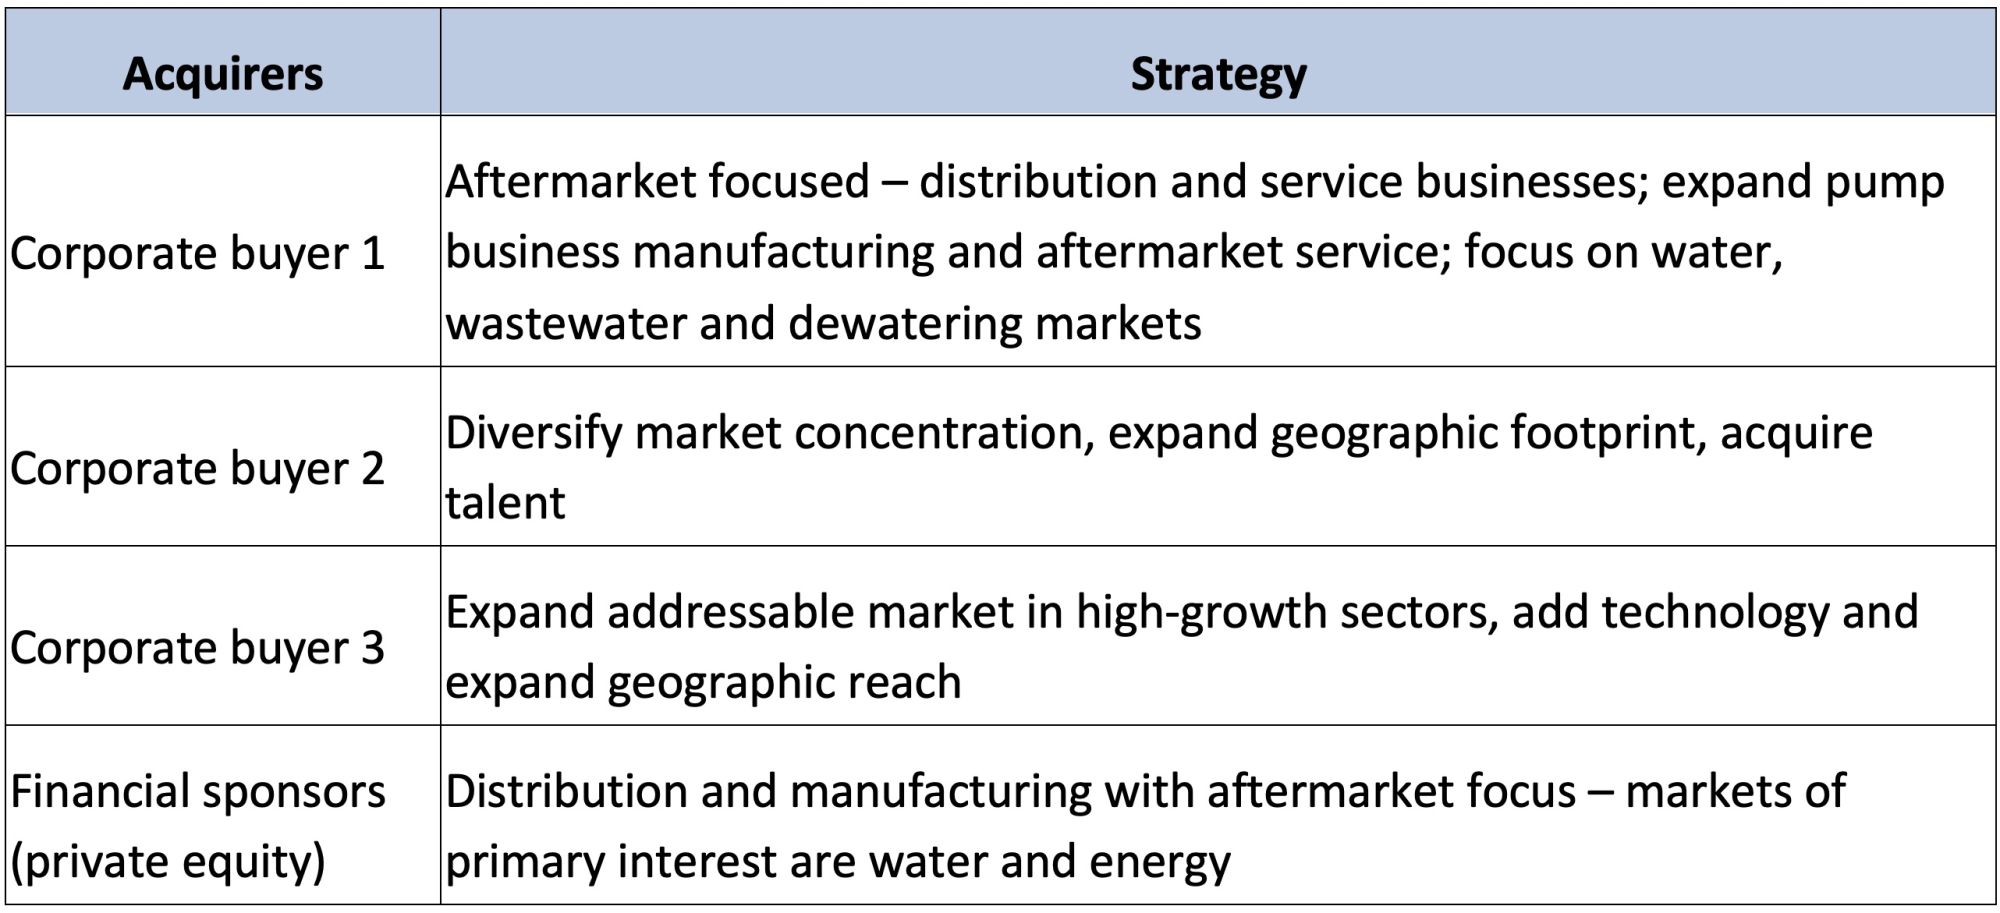
Strategies
Companies have various strategic reasons to pursue acquisitions. Below are the stated or observed strategic rationales for the highly active acquirers in the fluid handling industry.
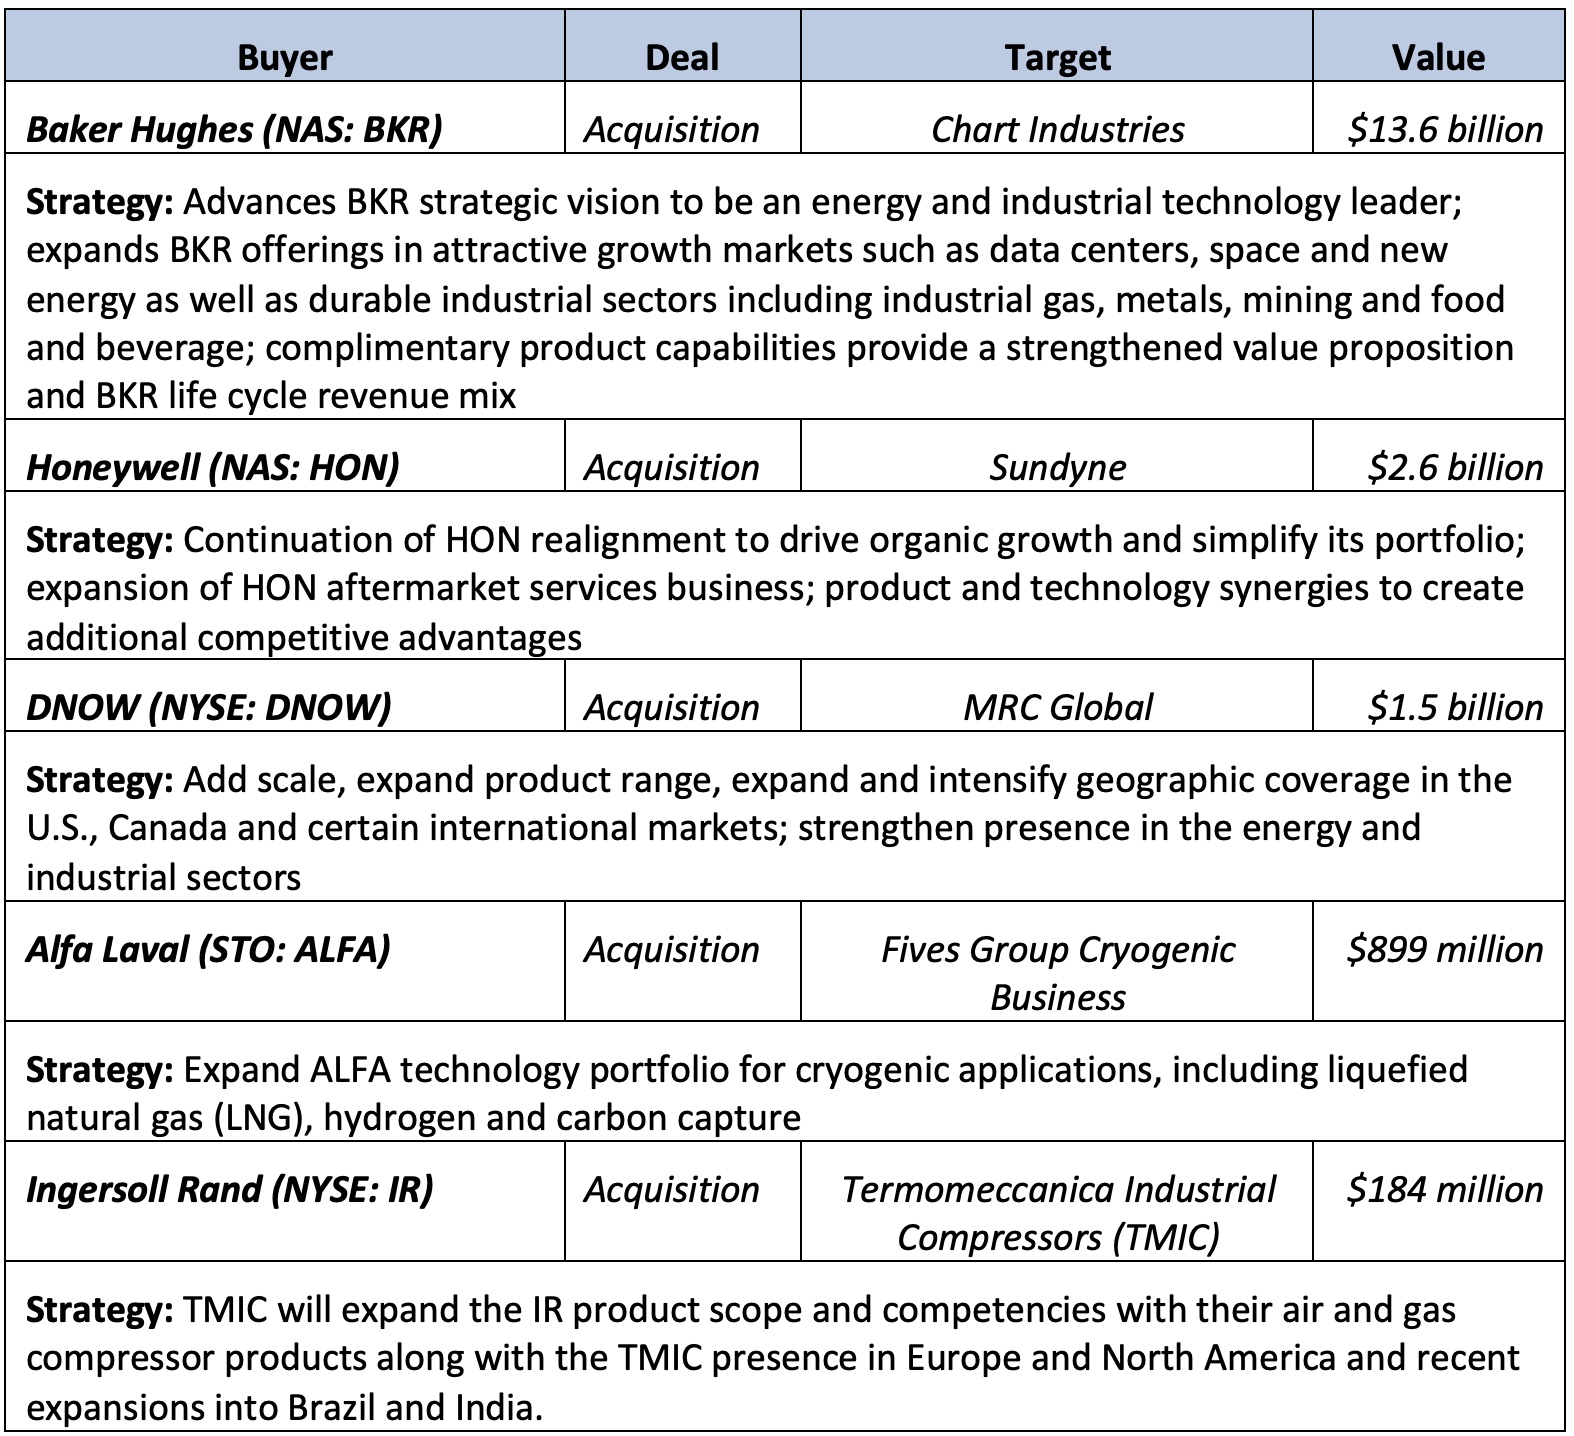
Largest Deals
It is interesting to note that all five of the largest transactions in the fluid handling industry through Q3 2025 targeted companies with a strong presence in the energy sector.
Valuations
Valuation information for deals in the fluid handling industry is limited. However, Image 7 shows the valuation multiples for transactions where that information was disclosed. These days, valuation information is usually only disclosed on transactions involving publicly traded companies where the deal size is meaningful to the size of the company and requires disclosure. Consequently, reported multiples tend to be skewed to the high end of the spectrum.
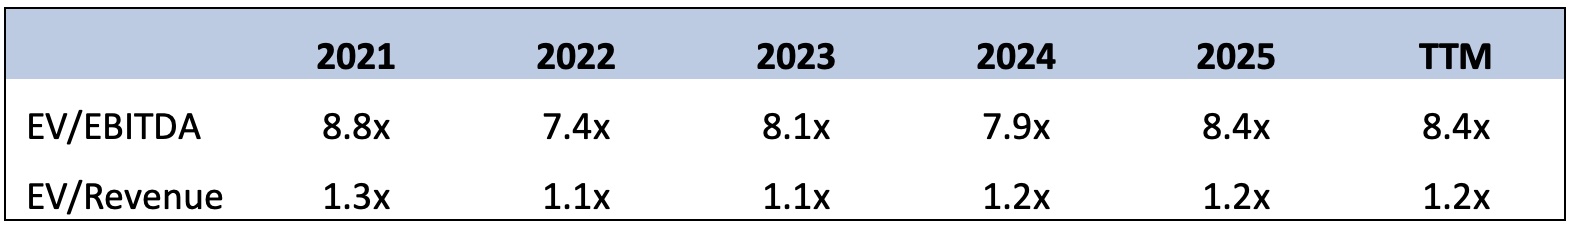
For additional context regarding valuation multiples, see the two additional sets of data in Image 8. The valuations shown are median values for business-to-business companies (B2B), including transactions of all sizes in North America and Europe. According to PitchBook's Global M&A report for Q3 2025, the B2B sector saw the return of mega deals (EV of $5 billion or more). This resurgence has most likely had an impact on the median EV/EBITDA multiple increase from 2024 to 2025 shown in Image 8.
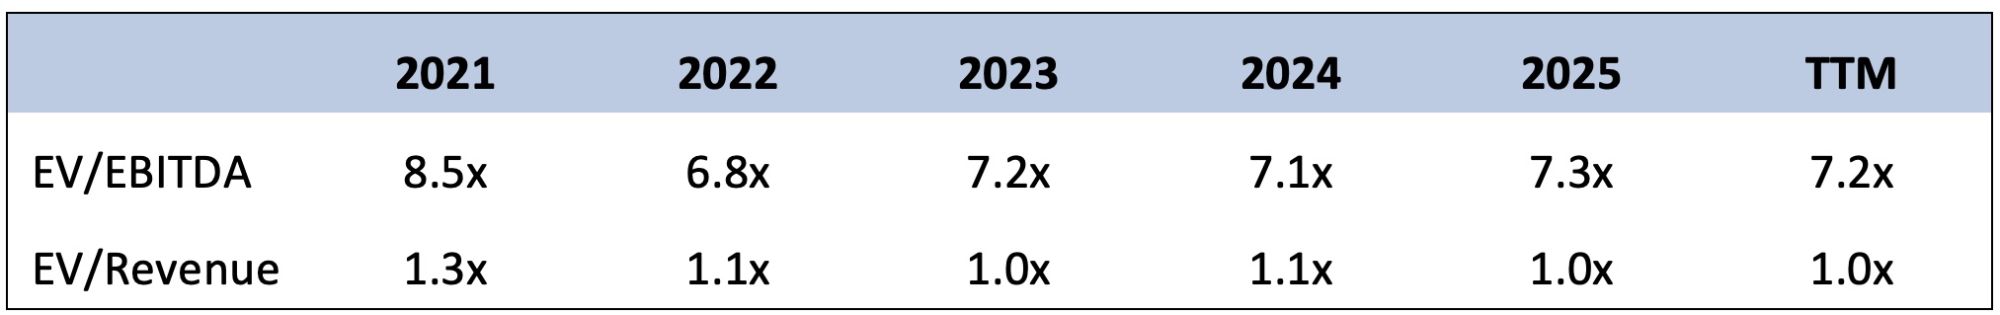
Image 9 shows global transactions for all M&A under $100 million. This view shows a much milder step up in the EV/EBITDA valuation multiples year over year from 2024 to 2025, which supports the premise that the large year-over-year step up in B2B EV/EBITDA multiples shown in Image 8 was impacted by the increase in mega deals.
Valuations are very transaction specific between a given buyer and a given seller. The information shown in the tables in this article can provide general guidelines. However, for individual company valuations, there are methodologies that can be applied to provide a specific indication of market value based on the company’s individual data.

Outlook
Thoughts for 2026
- Companies that have inorganic growth as a key part of their strategic growth plan will continue seeking quality acquisitions—demand will remain strong.
- Interest costs are likely to be stable to declining, and debt financing availability is likely to be neutral—not restrictive but also not overly accommodating.
- The headwind is more likely to come from apprehension about trade issues, unsettled geopolitical issues in Europe, other potential hot spots or signs of U.S. economic growth being below expectations.
- At this point in time, it seems there are enough positive factors offsetting the apprehension to support an active M&A market in 2026, but perhaps somewhat softer than the record level of 2025.
For more State of the Industry coverage, visit pumpsandsystems.com/tags/state-of-the-industry-2026.
