When facilities—whether paper mills, refineries, or chemical or waste treatment plants—decide to implement pump system improvements, the first question is always the same: Where to begin?

This month’s column looks at the pre-screening process, when plant management teams decide which system to tackle first. The pre-screening process quickly identifies which pump system has a high probability of improving plant operations, reducing total cost and increasing system uptime.

A pump system assessment takes an average of one week. Some system assessments will be profitable and have a short payback, but some may not meet the assessment goals established by a plant’s financial management team (see “A Financial Justification for Pump System Improvements,” Pumps & Systems, March 2014).

To improve the chance for success, the plant management team needs to start with systems that have high savings potential. That is the purpose of plant pre-screening. The following suggestions are outlined in the American Society of Mechanical Engineers (ASME) Energy Assessment for Pumping Systems standard:1

  • Focus on energy use and annual hours of operation. The greater the power consumption is, the greater the potential savings.
  • Concentrate on systems with centrifugal pumps operated at fixed speeds. Because pumps have a tendency to be oversized, they offer a great savings potential.
  • Pump systems that are controlled by throttle valves, bypass flow, recirculation or that are not controlled should be candidates for improvement.
  • Identify systems that have had major changes in design or operation since installation.
  • After discussions with the operation and maintenance staffs, identify systems that are difficult to control or experience high maintenance frequency
    or cost.

Pre-Screening Worksheet Development

A pre-screening worksheet is the best way to collect the required information. Once the data is collected, the operational management team can prioritize the worksheet to develop an action plan and start assigning resources.
The pre-screening worksheet presents collected data and identifies systems with a high probability of success. Exact data is not required during the pre-screening process. Facility managers should concentrate on identifying energy saving patterns that prioritize their plants’ needs.

The key to pre-screening is to collect easily accessible plant data first. Design documents, equipment data sheets and plant instrumentation have most of the information used during pre-screening. Conversations with a plant’s operating and maintenance personnel are also valuable resources. Reference 1 has a sample pre-screening data sheet.

Once the data is collected in an electronic spreadsheet, a weighting factor can be assigned for the data to meet the plant’s pump assessment program objectives. The set of weighting factors will differ depending on the program objectives. The factors for reducing energy consumption will not be the same as those for reducing operating and maintenance costs. The group assigning the priorities should have a clear picture of the assessment program’s goals.

In this example, the weighting factors will be for system usage—how many hours per year the pump system’s operation is required. Table 1 shows typical ranges for system use with a weighting factor. The system usage weighting factor identifies systems based on their annual hours of operation.

System usage indicates how long the equipment is operated per year.
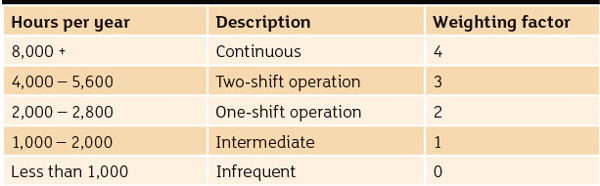
Table 1. System usage indicates how long the equipment is operated per year.
The weighting factor assigns a value to the system usage data. (Article graphics courtesy of the author)

Power consumption is another major factor in determining energy savings potential. Table 2 shows how to determine consumption using the horsepower (HP) rating on the motor nameplate.

Power consumption can be estimated from the motor nameplate.
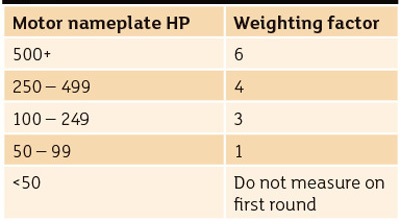
Table 2. Power consumption can be estimated from the motor nameplate. The weighting factor should be assigned to meet the plant’s ranges of pump motors.

For reducing costs, a weighting factor can also be assigned for fields indicating cavitation, method of control and maintenance costs.

Using the Pre-Screening Worksheet

The example in this section shows how the pre-screening worksheet prioritizes three systems:

  • System A has a single pump driven by a 500-HP motor. The system operates for 600 hours per year.
  • System B has a single pump driven by a 300-HP motor that runs 8,000 hours per year. During the pre-screening, maintenance personnel said these two pumps seemed to require more maintenance.
  • System C has two pumps running during operation. Each pump is driven by a 200-HP motor, and the system operates for two shifts. During the pre-screening, operations personnel said both pumps run constantly to minimize pump starts.

Weighting factors can develop a priority order for conducting the assessments, as shown below:

  • System A receives six points because it has a 500-HP motor and zero system unit points for a total of six points.
  • System B receives four points for its 300-HP motor and four points because of its continuous operation, for a total of eight points.
  • System C receives six points—three points for each 200-HP motor and three points for its continuous operation during two shifts, for a total of nine points.

If the primary objective of the assessment program is to minimize operating costs, then System C should be examined and overhauled first, System B second and System A third. If the objective of the assessment program is to minimize maintenance and operating costs, then a maintenance weighting factor of two may be added to System B. It now comes first with 10 points, System C second with nine points and System A third with six points.

Data Categories

Pre-screening data can be categorized into four groups: system, pump and drive, control, and operation and maintenance. Each category has a particular priority in the pre-screening process.

System

System data should include a system description, usage, the number of service years and the availability of design documents. The system should be described as it commonly is in design documents or as it is designated within the plant. Acronyms should be defined in the pre-screening documentation in case some personnel are unfamiliar with the plant terminology.

Depending on the system’s complexity, it may need to be divided into subsystems. For example, a waste collection system may have multiple collection points or sumps pumping to a combined sump. Rather than look at the entire waste collection system, evaluating each collection point may be easier.

System usage, or hours of operation per year, is a major indicator of the system’s saving potential. If a system operates continuously, its potential energy savings is much greater than a system with the same power requirements that is infrequently operated.

The ease of data collection is important to the pre-screening process. If a plant automatically logs operating hours for all equipment, then a record of the hours of operation for each pump can be printed and used as pre-screening data. If a plant does not, a rough estimate would still work for the pre-screening. The process primarily looks for trends in the data without going into detail, which is done during the assessment.

Time in service is also a useful indicator. The longer a system has been in service, the greater the probability that the system’s requirements have changed from the initial design. Pump systems should be evaluated every five years, according to standard.

Piping schematic availability is another factor in performing an assessment. A schematic drawing—either a flow or piping and instrumentation diagram—indicates system boundaries, equipment identifiers and flow streams. If a system schematic is not available, one should be developed before performing the actual assessment.

Pump & Drive

The pump and drive information should include the pump equipment identifier, pump description, location, availability of manufacturer’s pump curve and motor data. An equipment identifier for each component in the system makes it easier to look up information and provides a common name for everyone to use.

A verbal description of the pump is useful, especially if a system has multiple pump circuits.

The location of the pump within the plant should be given. If a pump is located outside, the assessment should be scheduled during good weather. If construction restricts access to the pump, the assessment should be delayed.
The manufacturer’s pump curve is required to perform a system assessment. Without a pump curve, the pump’s operating performance or cost cannot be determined.

The motor HP rating indicates the energy savings potential of a system assessment. The information is easily accessible and estimates the power used by the pumps in the system. The motor HP rating works best for pre-screening, but the actual pumping power should be calculated for the assessment.

Control

The control information includes the process control method and the position of the control valves or throttle valves if installed. Pump systems employ different control methods, from no control to variable frequency drives (VFD). Two methods are bypass control and pump staging.

Bypass control recirculates excessive flow from the pump discharge back to the supply. System flow requirements may vary, and the recirculating fluid maintains a constant header pressure. This control method represents an excellent savings opportunity and is a sign that the system needs an assessment. A system using bypass control weights higher during pre-screening.

Pump staging consists of running multiple pumps to meet different system loads. If the system is operated with all the pumps running regardless of system load, then significant savings can be easily achieved. Managing the pump stages and control methods presents an excellent opportunity for decreasing costs.

Control valves (including actuated valves, regulators and manual throttle valves) offer a good potential for energy savings, especially if a high differential pressure (dp) exists across the valves. A good indicator of high dp across the control valve is when the valve is slightly open. A control valve that is 30 percent open indicates a higher energy savings potential than a valve controlling at an 80 percent open position.

Pumps typically consume less power when a VFD is installed and operating properly. However, a system using a VFD may not be efficiently controlling the system. Some energy saving possibilities may still be available.

Operations & Maintenance

The maintenance department is a valuable resource in any assessment program. Most equipment failure is attributed to wear and tear. However, wear and tear failures are often the result of excess energy in the system. The removal of excess energy starts with the equipment.

Cavitation can occur anywhere in the system, including the pump, control valve, orifice or even pipelines. Any system with audible cavitation is an excellent candidate for assessment. Cavitation causes excessive wear and tear on the equipment and wastes energy.

Plant operators can provide valuable feedback on piping systems that are not meeting system or process requirements. These problems are often corrected by installing a larger pump or control valve. This may fix the symptoms but not the underlying problem if an undersized pipeline is causing a bottleneck. Increasing the pipe diameter may solve the issue without purchasing equipment. By performing a system assessment, the underlying cause of the problem can be identified and corrected.

If a proposed expansion is being planned for a pump system, an assessment is an excellent way to find out how the system is currently operating. This information provides a known starting point for a system that may have been in operation for a long period.

Conclusion

Arriving at a priority order for conducting system assessments involves a large number of pump systems. Pre-screening aids plant staff members in deciding which systems have the most savings potential. A priority order organizes readily available data on a plant’s pumps and contributes to the plant’s financial success. My next column will explore the pump system assessment steps: walkthrough, testing plan, operation evaluations and system improvements.

References

1. ASME EA-2-2009 Energy Assessment for Pumping Systems