Pump System Improvement
Engineered Software
07/25/2017
In my two most recent Pumps & Systems columns (read them here), we discussed methods for sizing pumps according to the design scenario. In many applications, the normal flow rate is less than the design flow rate for pump selection. Previously, we discovered that the flow rate through the sample system operates as outlined in Table 1, below.
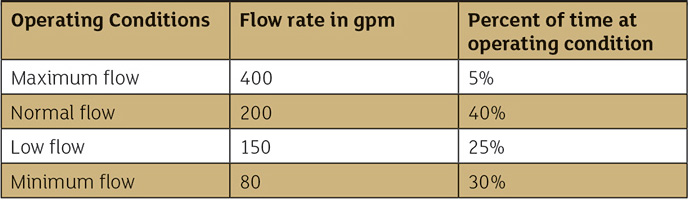 Table 1. Load profile showing flow rates and percentage of time at each operating condition. (Graphics courtesy of the author)
Simulations
Normally, one must wait for the system to be placed in operation to see how the total system operates. Using the methods outlined in previous columns, we can simulate how the system will operate during the design process. Since the maximum inflow of the system is 400 gpm, the transfer pump was sized for 500 gpm at approximately 22 hp. This allows the collection tank to be pumped down.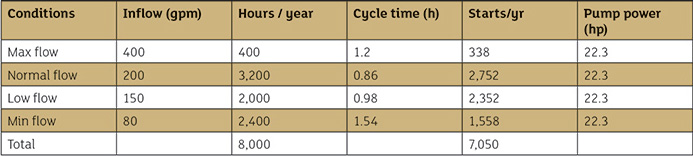 Table 2. Pump characteristics for various inlet conditions with existing transfer pump.
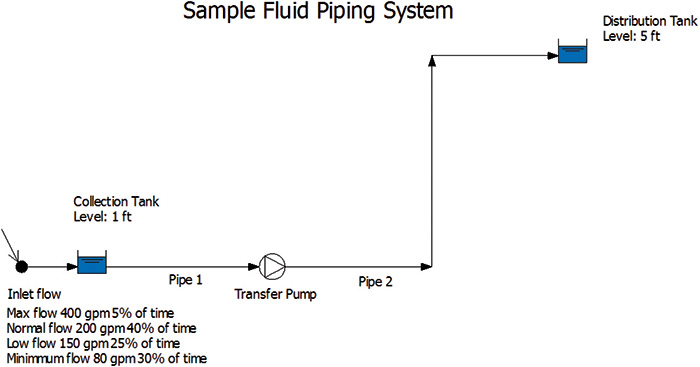 Figure 1. This graphic shows the system with a single pump and varying operational flow rates. The system controls have the pump start at a high level in the collection tank, and shut off on a low tank level.
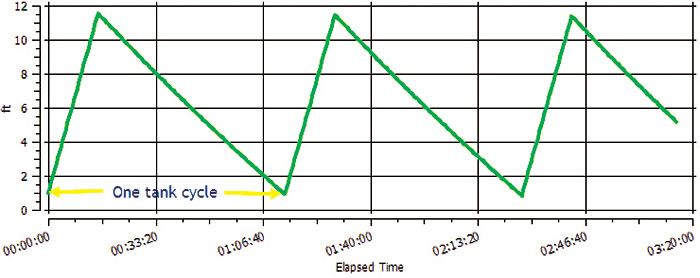 Figure 2. Collection tank level with one main pump and inflow of 400 gpm.
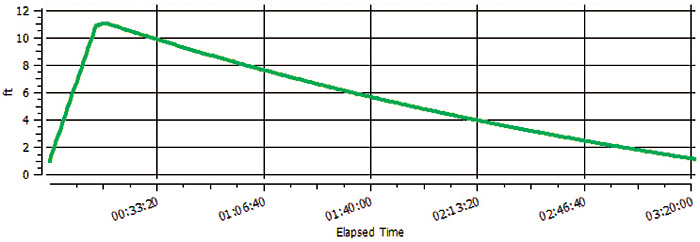 Figure 3. Collection tank level with two pumps and inflow at 400 gpm.
Evaluating Two-Pump Operation
In the next example, we will evaluate the same system with changes to the pumping characteristics. Rather than a single pump, there are two identical pumps sized so each provides a design flow of 210 gpm with 100 feet of head. The system controls are set up so the first transfer pump starts on a level in the collection tank of 10.5 feet, with the second transfer pump starting slightly higher at 11 feet. The pumps are both stopped when the one foot liquid level is reached in the collection tank. After performing the system simulation, the multiple pump scenario results are displayed in Table 3.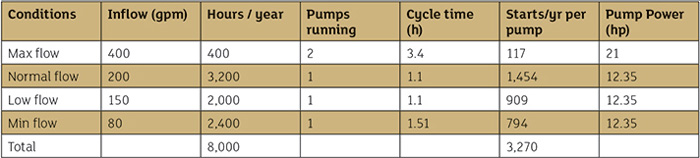 Table 3. Pump characteristics for various inlet conditions while operating two pumps in parallel.
Conclusion
When comparing the operation of the system with one large transfer pump and the system with two small transfer pumps, their performance is similar in the design case of maximum flow. However, this only occurs during 5 percent of the operating hours. Commonly in these types of systems, most operating hours are spent well below the maximum designed flow rate. When operating at lower flow rates, the system with smaller pumps consumes less power for the operation. Additionally, the single pump system goes through more pump starts than the two-pump system. The cost of the second pump and driver will most likely add to the initial cost. Knowing how the total system will operate we can see that the two smaller pumps will consume less power and have fewer pump starts. This will save energy and maintenance costs each year. In the past, one would have to wait until the system was designed, built and placed in operation to look for ways to improve that system. Then it is already too late—changes are difficult and costly after the plant is already operating. Using the simulation techniques discussed in this series, users can analyze how a system will operate over a wide range of expected conditions during the design phase and, ultimately, discover ways to improve the system.For more Pumps System Improvement columns, click here.