

In the heart of northern Michigan’s tourist corridor, the Elk Rapids Wastewater Treatment Plant manages the ebb and flow of seasonal surges, industrial discharges and the residential flow of a small community. With just two staff members and a third on the horizon, the plant treats up to 400,000 gallons per day in summer, nearly double its winter flow.
The plant faced a challenge, however, in its use of spreadsheets, siloed folders and manual reporting. Looking for a better way to manage their information, they turned to a modern, cloud-based compliance and operations platform built for mobile data entry, lightweight analysis and field visibility.
Centralized Data, Streamlined Reporting
The plant’s priority was consolidating data, as it receives influent from residential sources and two industrial contributors: a cherry processor and a brewery. Prior to the technology switch, the contributors’ data was kept in separate folders. With the current platform, it is kept in a single place, allowing the plant to easily generate reports, track trends and compare industrial versus residential loading.
Smart spreadsheet and graphing tools have also been of great help to the plant. They have built custom sheets to track lift station runtimes, influent loading and seasonal flow variations. This is particularly useful when it comes to visualizing flow versus pollutant concentration. If there is high flow but low loading, the plant staff know the water is clean. If there is low flow and high loading, they know that something has been dumped into the water and an investigation will be necessary.
The plant has also found monthly reporting much easier with the new platform, as they are able to copy and paste from the program’s spreadsheets directly into an online portal, then do a quick verification. This enables them to avoid retyping numbers and thus risking errors. They are also exploring surcharge modeling for industrial contributors, as the technology makes it easy to track pollutant loading and build out billing models.
Simplified Seasonal Complexity
Elk Rapids’ flow nearly doubles between Memorial Day and Labor Day, driven by summer residents and local events like Harbor Days and Cherry Fest. During peak weekends, it can reach approximately 410,000 gallons per day, while in the winter, it drops to between 200,000 and 250,000.
The plant’s extended aeration lagoon system is forgiving, with detention times averaging 80 hours in summer and up to 110 hours in winter. Colder months bring a different challenge with too little organic loading meaning a lack of nutrients for the microbial population. As a result, the plant must avoid wasting any activated sludge between November and March or risk losing their biological treatment capacity.
To keep the microbial population thriving, the team doses the lagoons with nutrient-rich packets that include a dehydrated blend of phosphorus, nitrogen and supplemental microorganisms. This “winter diet” keeps the microbes thriving, and smart data tools allow the plant to track dosing and retention times.
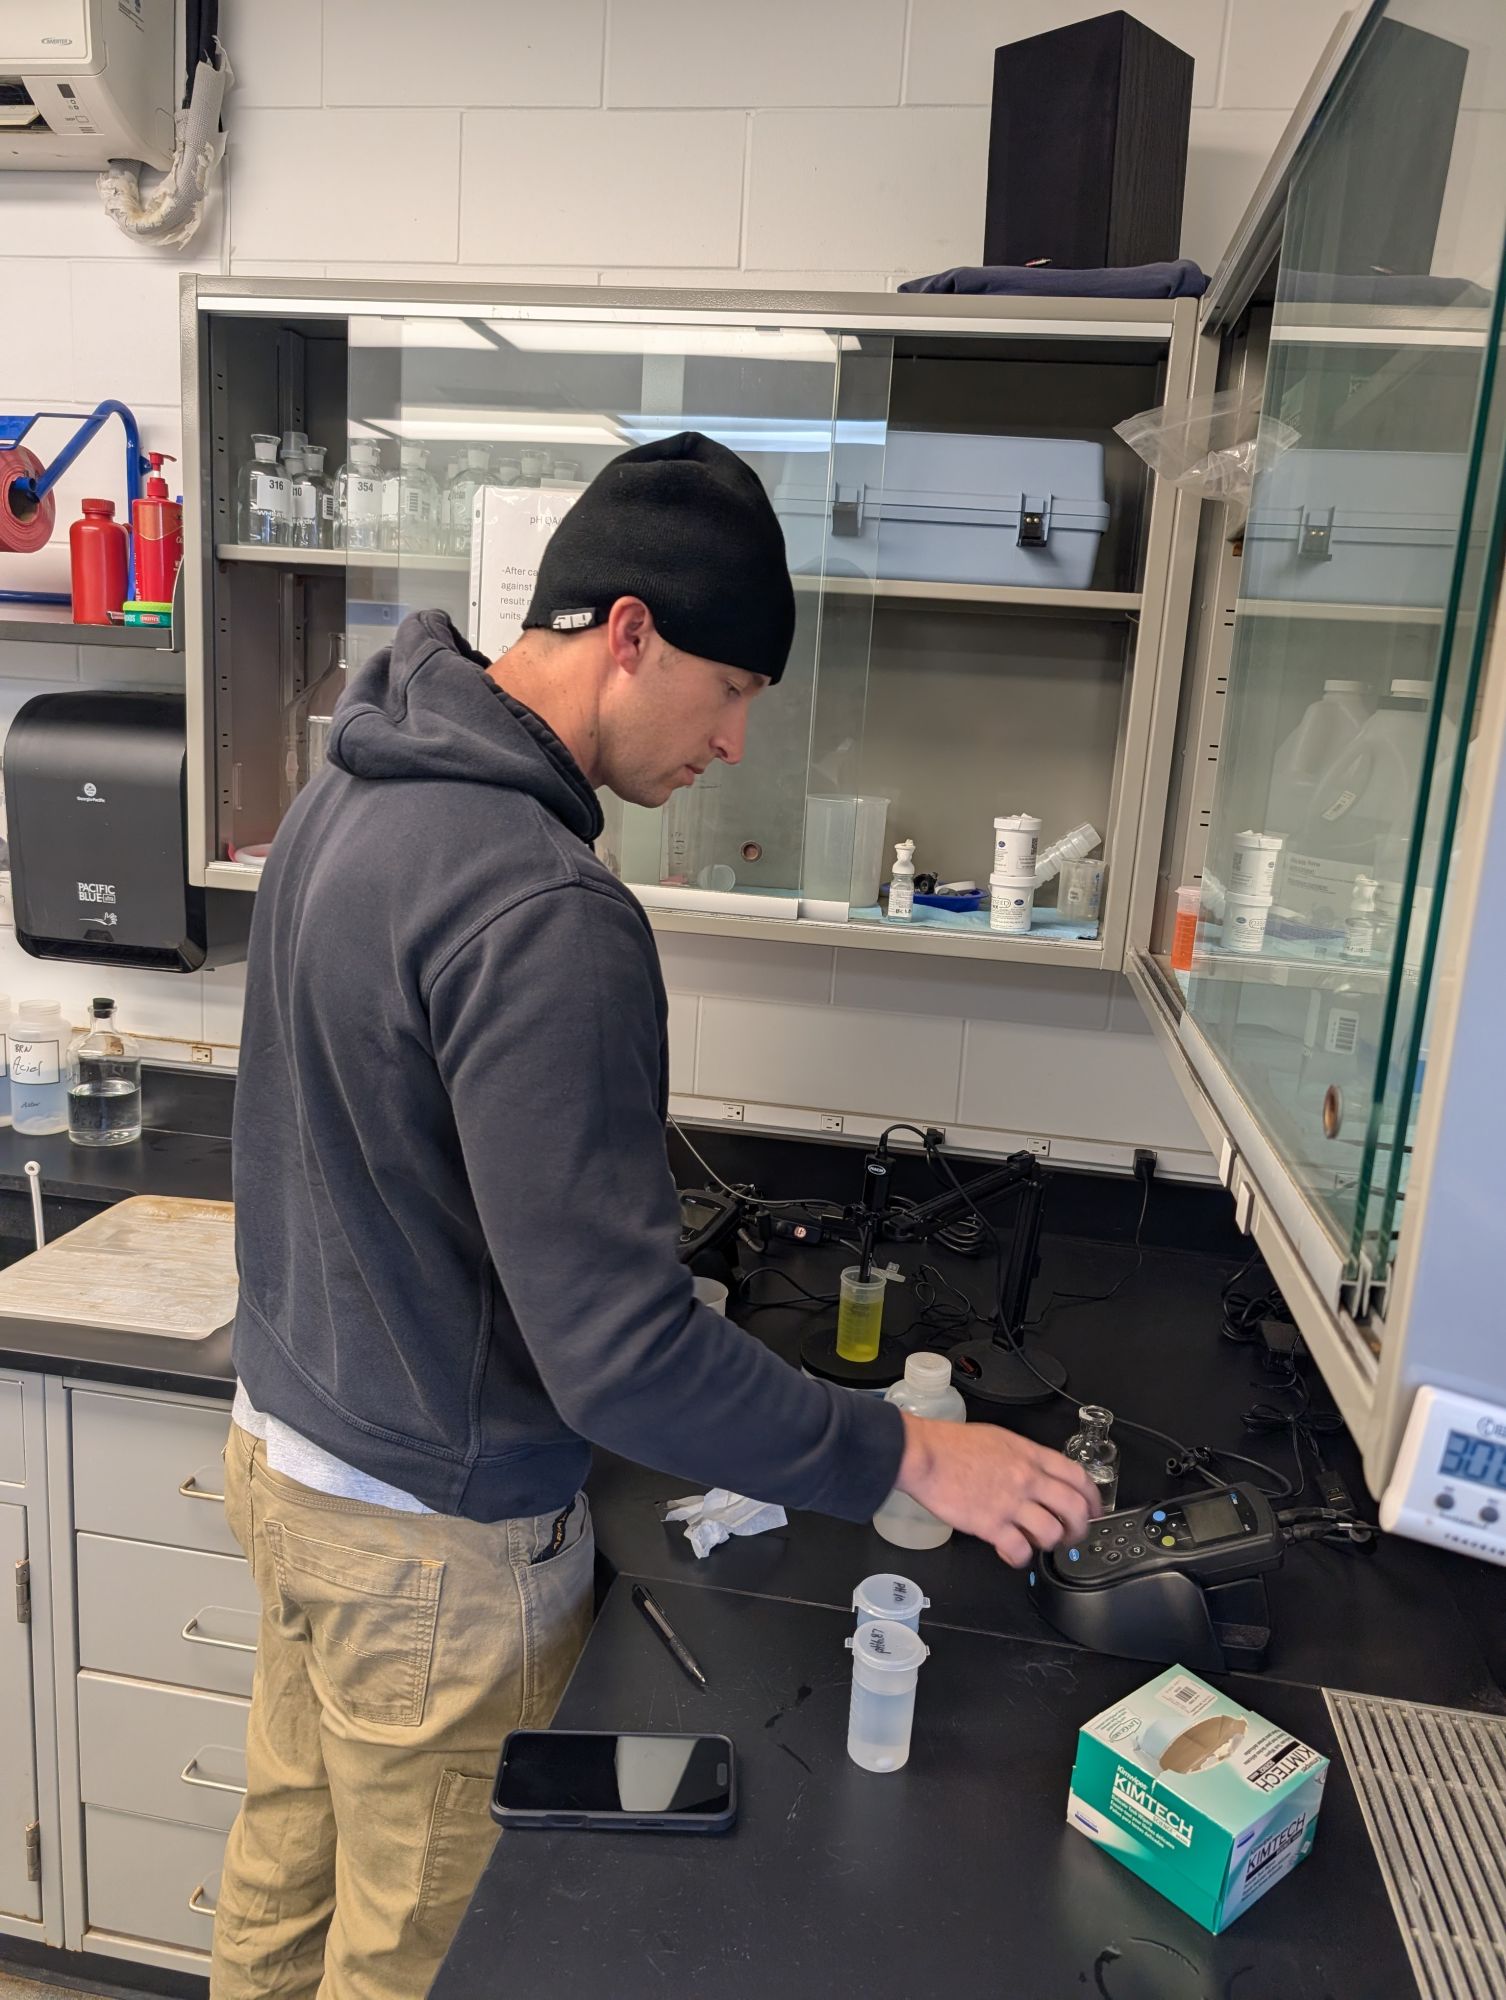
Empowering New Staff
With a new lab technician on board, the software’s alerting system has become a good training tool. The new staff member is able to build confidence and catch issues early by noting what the software has flagged with red or yellow indicators. As quality assurance/quality control (QA/QC) checks for standards and duplicates have also been configured, the lab tech is able to validate results without supervision. Email notifications likewise add another layer of security, providing alerts about concerning readings to senior staff even when they are offsite, which allows them to provide guidance remotely when needed.
Mobile Monitoring & Lift Station Insights
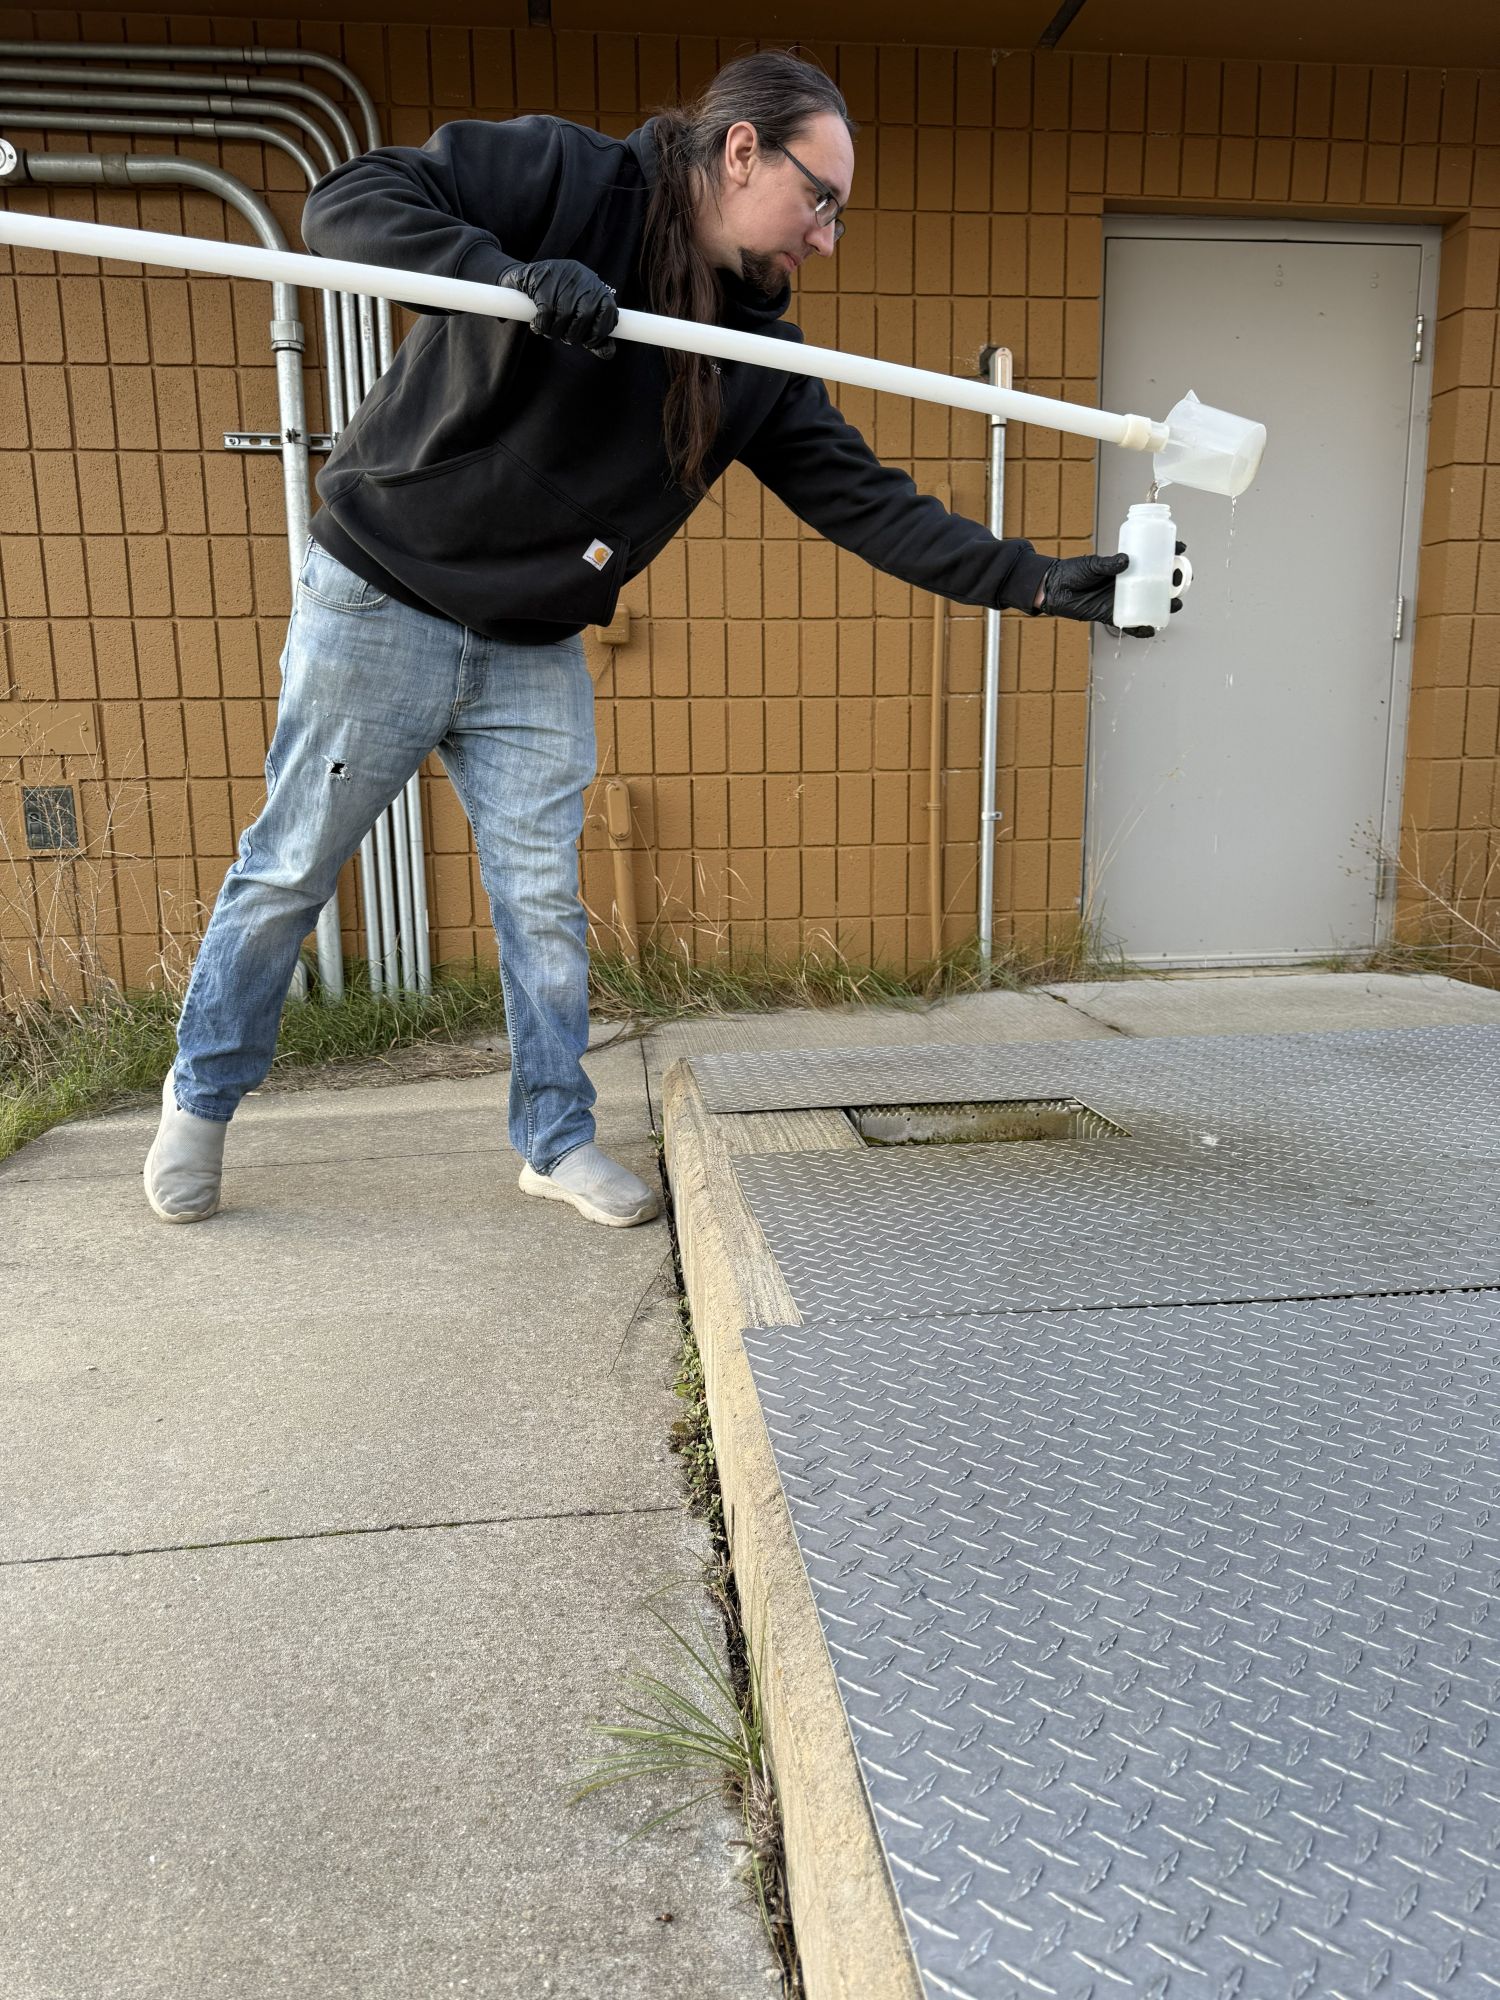
Elk Rapids does not have flow meters at its lift stations, so the staff use smart monitoring software to log pump runtimes during weekly inspections. This helps them spot infiltration during rain events. If one pump is running longer than usual, this tells them it may be plugged or there may be inflow from somewhere upstream. These insights are especially valuable during storm events, when understanding system behavior can inform capital planning.
Looking Ahead: SCADA Integration & Historical Trends
While the shift to smart data management has transformed daily operations, the plant is also looking to upgrade other aspects of their operations for better supervisory control and data acquisition (SCADA) integration. The goal is to pull data at 15-minute intervals, which will offer better visibility into overnight events and system performance.
They also plan to import historical data from past years to build out seasonal trend analysis, as this will allow them to plan chemical dosing and operational changes with even greater precision.
For the Elk Rapids plant, the shift to digital is not just about convenience and operational efficiencies; it is about resilience. With such a small team, having systems that can step in and keep things running is vital. Smart data management can offer that structure.
For more on SCADA, visit pumpsandsystems.com/tags/SCADA.
