Unlock a pump’s full potential while saving energy and maintenance dollars.
07/16/2014
Pumping systems comprise almost 25 percent of all motor energy usage in building and HVAC, water and wastewater, oil and gas extraction and transportation, and irrigation applications. Efficient pumping systems can save users more than 50 percent in potential energy costs. In addition, electrical energy costs represent 40 percent of the total cost of ownership (TCO) of pumping systems (see Figure 1). Yet organizations struggle to leverage cost reduction through efficiency improvements. The following major barriers need to be recognized and addressed:
- Energy efficiency has traditionally not been a primary focus for assessing system performance. In most organizations, energy utilization has only just been introduced as a corporate metric.
- A lack of awareness in overall pump system energy efficiency opportunities is common. As a result, potential savings and other benefits have been missed.
- Lack of funding has resulted in operations personnel struggling to present attractive investments to their senior management.
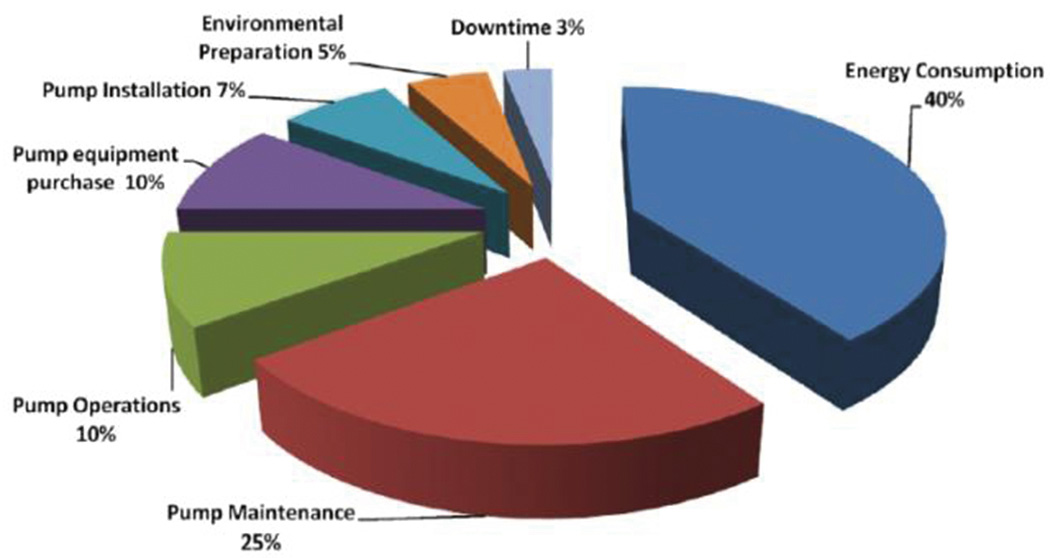 Figure 1. Typical pump life cycle cost profile (Courtesy of Hydraulic Institute and Pump Systems Matter)
Energy Efficiency Management
The Department of Energy is currently developing minimum efficiency standards for pumping systems. In addition, industry trade and government organizations such as the Air Conditioning, Heating, and Refrigeration Institute (AHRI) and the American Society of Heating, Refrigeration, Air Conditioning Engineers (ASHRAE) have joined the DOE in introducing standards to mandate minimum efficiency requirements for motors and variable speed drives (VSDs). The DOE Energy Policy Act and ASHRAE 90.1 (Energy Standard for Buildings Except Low-Rise Residential Buildings) are some of these standards. In pumping systems, most inefficiency comes from:- A mismatch between the pump deployed and the actual system requirement (i.e., undersized or oversized)
- The improper use of throttling valves and flow-restriction technologies to control the volume and pressure of liquids
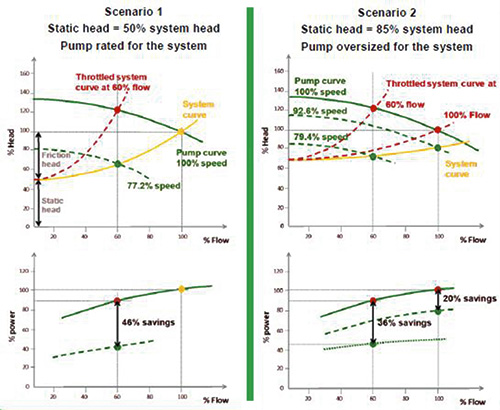 Figure 2. Energy saved with variable versus fixed speed drives at 100 percent and 60 percent flow, according to the static head and pump sizing. The operating point is represented as the intersection of the pump curve with the system curve.
- At fixed speed (in the throttled system example), a throttle valve must be added to the hydraulic circuit. This adjusts the flow by increasing or decreasing the flow resistance. This will modify the system curve. However, the speed remains the same, so the pump curve does not change. The flow rate is matched, but the head is much higher than required, resulting in poor energy savings.
- If a variable speed drive is deployed, the system curve does not change. The pump curve is modified according to flow speed and affinity laws (rules of hydraulics that express the relationship between variables involved in pump performance such as head, volumetric flow rate, shaft speed and power). Adjusting the speed matches the process requirement and results in significant energy savings.
- Scenario 1 (see Figure 2, left): The static head represents 50 percent of the system head, and the pump is rated for the head and flow of the system. At 100 percent flow, the power consumed by the pump is the same at both fixed speed and with a variable speed drive. At 60 percent flow, the energy savings resulting in the variable speed drive use is 46 percent.
- Scenario 2 (see Figure 2, right): The static head represents 85 percent of the system head, and the pump is oversized by 20 percent. Therefore, a variable speed drive saves 20 percent of energy at 100 percent flow and saves 36 percent energy at 60 percent flow.
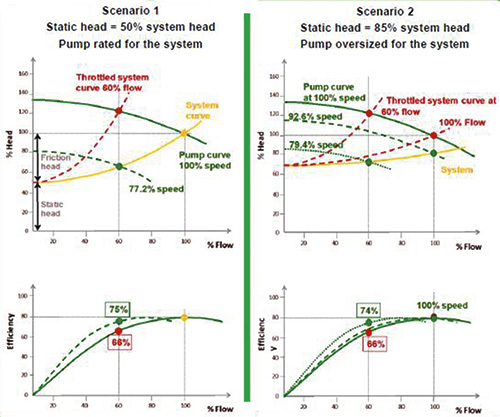 Figure 3. Comparison of two efficiency scenarios at different flow rates: 8 to 9 percent more efficient with variable speed drives at 60 percent flow
Asset Management
Physical assets, such as pumps, need to be maintained on a regular basis. Maintenance costs represent 25 percent of TCO (see Figure 1), so examining maintenance practices can make a positive contribution to energy-influenced savings. The challenge behind reducing maintenance costs is ensuring system integrity remains stable, but with the right steps, operators and maintenance specialists can strike an affordable balance. All pumps should be operated within the parameters of a given pump’s specifications. As discussed, pump efficiency varies according to operational parameters. The pump is designed for optimal operation at the BEP, but 75 percent of pumping systems are oversized by about 30 percent to meet anticipated lifetime peak production or to rationalize spare parts inventory. Figure 4 illustrates how pumps begin to waste significant energy when appropriate maintenance practices are neglected. For example, discharge recirculation can occur if the pump operates at 65 percent of the BEP flow rate, damaging the impeller.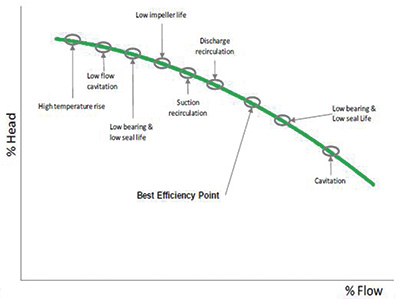 Figure 4. Maintenance-related issues that impact pump performance (Courtesy of Barringer & Associates, “Pump practices & life”)
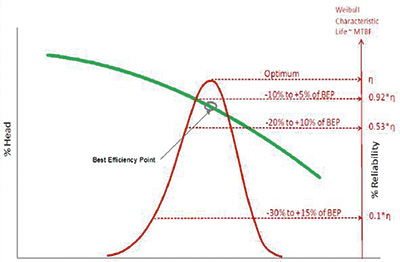 Figure 5. Effect of the distance from the BEP on reliability (Courtesy of Barringer & Associates, “Pump practices & life”)
Cost-Effective Maintenance Strategies
There are three main approaches to cost-effective maintenance. Preventive maintenance is the systematic inspection and detection of potential failures before they occur. Condition-based maintenance is a type of preventive maintenance that estimates and projects equipment condition over time, using probability formulas to assess downtime risks. Corrective maintenance is a response to an unanticipated problem or emergency. Figure 6 illustrates the cost curves of these three types of maintenance. Condition-based maintenance is the most cost-effective of the three approaches. Condition-based maintenance monitors system data on an ongoing basis and provides an accurate assessment of the system’s status. of its With pumps, variables such as suction pressure, discharge pressure, pump speed, power, flow and temperatures are monitored to detect a loss of efficiency. Combining the efficiency and process variables identifies potential problems.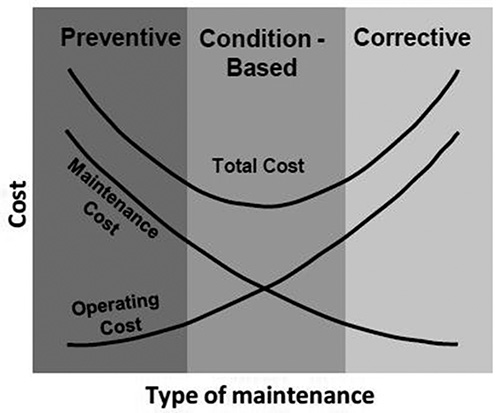 Figure 6. Cost curves of the different maintenance approaches (Courtesy of Penn State University Applied Research Laboratory, “Open systems architecture for condition-based maintenance”)