

In many companies, operational data is still kept in separated silos, adding an extra challenge to improve operational excellence by use of advanced analytics. However, when organizations choose to leverage time-series data, the lessons learned can help sites quickly adopt the self-service analytics tool and benchmark site performance independent of the exact location where the original data is stored.
The various use cases addressed with the self-service analytics platform provide many benefits. One of the most important is an increase of stable operations, also directly leading to a safer production site. The extra benefit is better control over product quality.
Case Study Example
Huntsman Corporation is a family-led, publicly traded global manufacturer and marketer of differentiated and specialty chemicals. Its digitalization journey started years ago, and one of its quickest wins was to take advantage of its time-series data.
Huntsman selected a self-service analytics platform to help their process and asset experts contribute to their corporate operational goals.
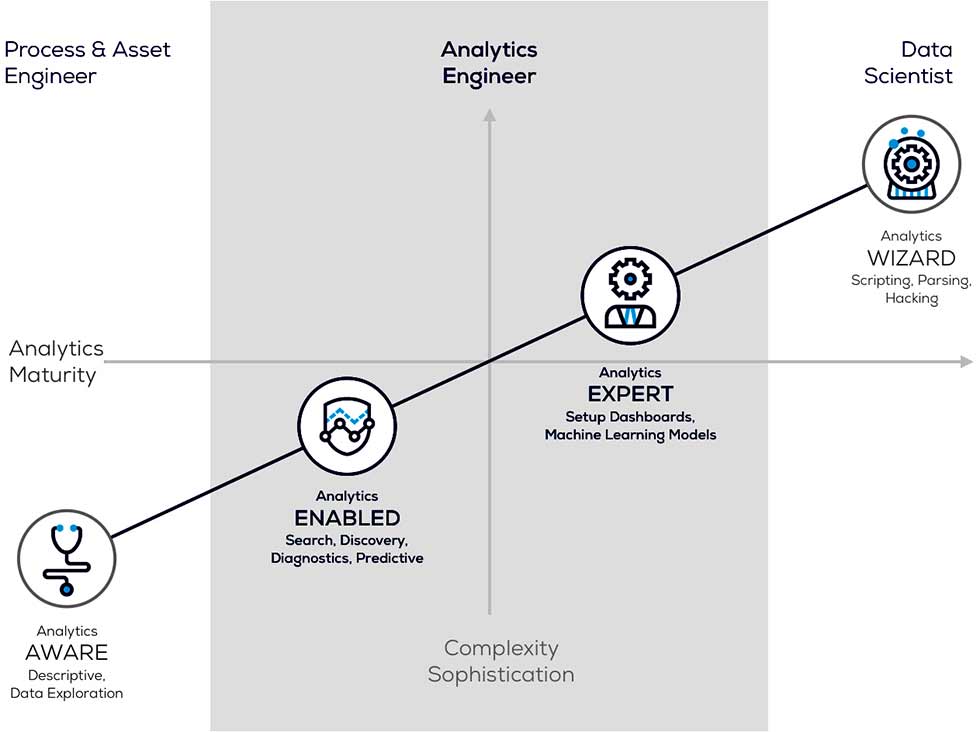 IMAGE 1: Self-service advanced analytics engineer platform (Images courtesy of Trendminer)
Business Challenges
Huntsman, like any other process manufacturing company, has gathered operational data for years. Typically, the engineers are using their experience in combination with data for their daily work. So, one might think their work is data driven, but it is typically experience driven, and the data is colored with their own experience.
Huntsman’s journey was actually to move from experience-driven to data-driven. When undertaking this move, a common challenge is related to data skills. To combat this, the process engineer should talk with the data scientist to gain an understanding of where the engineers are looking and how they are interpreting trends. The data scientist likely thinks in algorithms and statistical models, so, a common ground must be found for those disciplines to start talking to each other.
The other challenge is related to the way of working, captured in methods, management and mindset. Mindset is what it is really about—people having the mindset to use certain tools and wanting to make it a success. That does not mean the methods and management should be forgotten. A successful transformation addresses all three aspects.
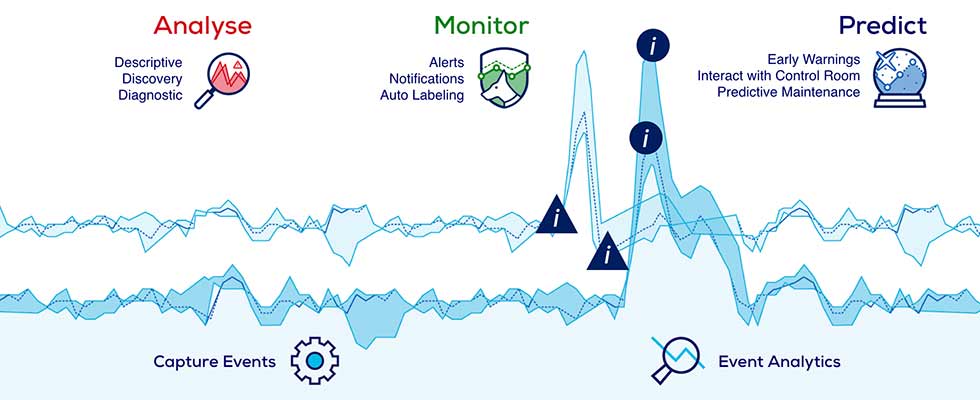 IMAGE 2: Pattern recognition
Self-Service Advanced Analytics
For using the sensor-generated, time-series data, one solution is to create a position for an analytics engineer. Engineers can be empowered with advanced analytics or data scientists can learn to be more process-oriented, as long as the person knows where to operate. This person will know what he needs to be able to do and talk to the various disciplines. Engineers are used to looking at data trends from their historians, so it is easy to empower them with new plug-and-play tools.
A few years ago, Huntsman selected a self-service analytics tool to go from pure diagnostics (what has happened and why), to a tool that shows what is behind the trend.
By using self-service analytics, the engineers became more effective in looking at trends, searching back in time and comparing good with bad situations. This empowered them to come up with a solution in case of an operational problem.
The basis of the self-service advanced analytics platform is rapid-fire pattern recognition. Here is how this operates:
- The first step is to analyze the patterns. What do the patterns show us? It can look at the past, compare patterns and see good and bad behavior of the production process.
- The next step is to use the tool to monitor those patterns followed by using the monitors to predict operational performance and create early warnings with messages. This can be done for operating conditions and maintenance.
- Lastly, for continuous improvement, the self-service analytics tool can be used in each phase of the classic DMAIC (define, measure, analyze, improve, control) cycle used by engineers and in the Six Sigma methodology to improve operational excellence. (Six Sigma seeks to improve processes by removing the causes of errors by setting up a management system to identify errors and provide methods for eliminating them.1)
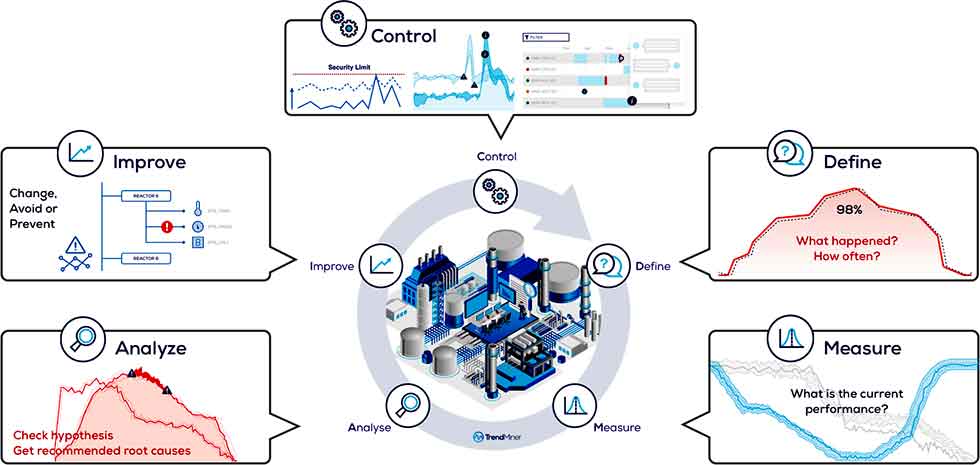 IMAGE 3: Screenshots of the DMAIC cycle
Case 1: Soft Sensor on Quality
A continuous isocyanate plant of Huntsman’s has been collecting process data for years and collecting offline-created lab analysis data daily, both stored in their historian. It was quickly discovered that combining the two types of data can be used to build soft sensors, predicting what the quality is going to be. This soft sensor is used to make micro-adjustments to process setpoints to reduce frequency of off-spec production.
An added value quickly became clear. Since some analysis can only be done during the week and production also runs over the weekend, the system can already predict whether a certain parameter is going to be off-spec during the weekend. The early warnings via the monitors can tell the operators not to load the truck, preventing off-spec material from going to the customer. On the other hand, when the operator is not sure and they load the truck, the laboratory can confirm that the quality is acceptable. This can have a positive impact on lead time as well as on quality control.
Case 2: Batch Processes With Fingerprinting
Huntsman was checking batches in Microsoft Excel, which was laborious and required expertise. Today, this is done by creating fingerprints with the self-service analytics tool, which can tell whether a batch is produced in-spec or not.
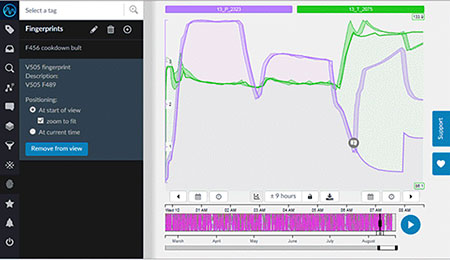 IMAGE 4: Batch analysis using fingerprinting
In a specific batch process, Huntsman required distinct pressure and temperature profiles were required to consistently create high-quality material. Time series patterns from known good batches were grouped and saved as a “fingerprint.” The golden batch fingerprint is then used as a real-time monitor to continuously check the process for deviations. Subtle disturbances, which would be difficult to capture in a numerical model, are quickly identified using the fingerprint. So, there is no need afterwards to check if there have been abnormalities. The monitors give early warnings during a batch process in case something is going wrong, allowing the operators to take appropriate action in time. This new method of batch analysis has led to a reduction in off-spec batches and increased product quality.
Case 3: Product Quality Improvement Using DMAIC
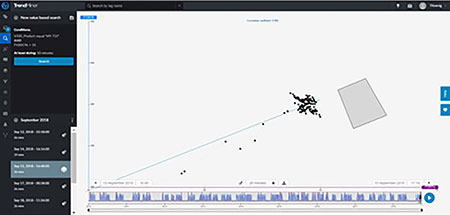 IMAGE 5: Six-Sigma DMAIC analysis
An advanced materials site of Huntsman’s in the U.S. experienced many of its product batches that run in a wiped film evaporator exceed the specification limit of unreacted feedstock, resulting in off-spec products. They were observing a multiyear drift in quality as measured by the quality assurance lab. It was suspected that a change in testing methods led to this result, however, the frequency of off-spec production demanded a resolution.
A complete Six-Sigma DMAIC analysis was done with various capabilities of the self-service analytics platform, such as value-based searches, layer compare, statistical comparison tables, recommendation engine, filtering and the use of scatterplots. Multiple differences in the plant between on-spec and off-spec production campaigns were revealed. Through area search in scatterplots, it becomes quickly clear if performance is in or out of the best operating zone. The differences were enough to convince experts that there were long-term changes occurring in the process. Through further investigation, the root cause was identified, resolved and immediate quality improvements were confirmed days later.
With the self-service advanced analytics platform, the root cause analysis was done faster, on a larger data set, identifying subtle operating differences and more tests can be done. A side result was the increased trust in the lab data. With the related test data from the laboratory, everybody can now quickly see if the lab data can be trusted or not.
Benefits, Results & Lessons Learned
Through employee efficiency and making data-driven decisions, the use of self-service analytics helped break down organizational silos. Another value of self-service analytics lies in easily and quickly built soft sensors, which help to monitor the operational performance but also help at startup of the production line. Even if certain sensors are not working properly, a soft sensor can be created quickly using other parameters to help control a safe startup process.
Besides quality improvements of the product, Huntsman was able to improve processes and asset reliability, improved capacity without capital investments and the creation of the data-driven engineering support.
Reference
1. www.sixsigmadaily.com/what-is-six-sigma/
