First of Two Parts

Last month’s column explained how to make sure the entire team understands the pump system’s operation with an energy cost balance sheet. This column discusses using those techniques to work through the assessment process.

First, develop an energy cost balance sheet based on how the system currently operates. Then identify system improvement options, and generate an energy cost balance sheet for each. The balance sheets provide the plant’s financial management team with the data required to decide on an action plan based on the potential risks/rewards.

Current System Assessment

In the demineralized water system that has been used in this column, a typical process system is assessed. This system consists of a supply tank, centrifugal pump, process component, destination tank and two control loops (see Figure 1). Downstream from the process pump, some of the flow is returned to the supply tank to maintain a 100 psi pressure. The remainder of the system flow runs through the process component, flow element and onto the destination tank. The level in the destination tank is maintained at 5 feet by a level control valve.

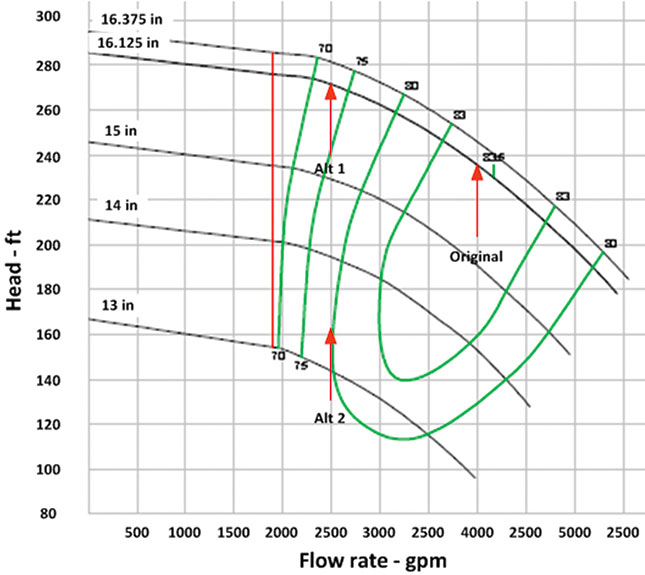
Figure 1. The pump curve shows the location of the original flow, the flow of Option 1, and the flow and head of Option 2.

The flow rate into the system’s destination tank averages 2,500 gallons per minute (gpm) to maintain the tank level. This system is currently operates 8,000 hours per year to meet the plant’s production needs, and the system has operated this way since it was commissioned five years ago. An assessment was performed because of the system’s continuous operation, the position of the level control valve and because bypass control is used to maintain the pump’s downstream pressure.

The system currently operates with two circuits, a process circuit and a bypass circuit. Both circuits are supplied by a common pump, so the energy (or head) consumed by each circuit equals the head produced by the pump. The calculation of the pump operating cost (see Table 1) is critical.

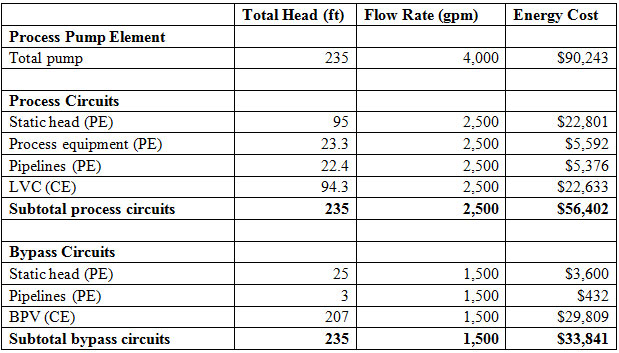
Table 1. The energy cost balance sheet for the operating system—notice that the total pump energy and power cost is the same as the sum of the process circuits.

The manufacturer’s pump curve is key to understanding the pump’s operation (see Figure 1). The flow element shows the flow rate to the process tank required to maintain the level, and it does not include the bypass flow. The pump head of the process pump will be used to determine the flow rate through the pump. The installed pressure gauge on the pump discharge will be used in the calculation. The suction pressure will be calculated by using the liquid level in the supply tank, elevation of the pump suction and the estimated head loss in the suction pipeline.

A calculated pump head of 235 corresponds to a flow rate of 4,000 gpm and an efficiency of 83 percent according to the pump curve. A fluid density of 62 pounds per cubic foot (lb/ft3) was obtained from the process engineer, and the average power cost of $0.05 per kilowatt hour (kWh) was established by the energy assessment team. The annual pump operating cost (AOC) is calculated, using the equation on page 25, at $90,243 per year.

Because the process pump is the sole source of fluid energy, this cost represents the system’s energy cost. The energy cost balance sheet for the system under its current operation is provided in Table 1.

The head consumed by each element in the system and the associated power cost were calculated using the operating data from the installed plant instrumentation and the pump curve, process equipment data sheets, and control valve data sheets provided by their respective manufacturers. The calculation details will be explained in future columns.

In the energy cost balance sheet, approximately one-third of the total energy is used by the bypass circuit. It appears that the system is an excellent candidate for reducing operating cost and improving plant profitability.

Consider Alternatives

System improvement opportunities can be analyzed. The primary focus is the elimination of the bypass circuit. Four alternatives are suggested:

  • Change the plant’s operation procedure to eliminate the need to maintain a continual bypass for pressure regulation.
  • Eliminate the bypass control and trim the impeller to reduce excessive head across the level control valve (LCV).
  • Install a variable speed drive (VSD) to establish level control in the destination tank by varying the pump speed.
  • Purchase a new pump to meet the current system’s needs.

The decision to implement any option should not be made quickly. Its effects on the system operation should be well understood by all stakeholders. However, identifying and sharing the cost of operation for each alternative helps encourage communication between the different plant groups.

After reviewing the design documents, the team learned that the bypass was originally installed to ensure a minimum flow through the process pump during plant startup and shutdown. Over time, the bypass was operated regardless of plant load to eliminate the possibility of low flow rate through the pump during large changes in plant load.

Plant operating records indicate that the flow rate through the system has never been below the manufacturers minimum flow value for the pump. After a discussion with the operations, instrument departments and the pump supplier, the team determined that continual bypass was not required. As a result, a systems assessment on the proposed changes was conducted.

With the bypass closed, the pump delivered 2,500 gpm to the destination tank. According to the pump curve, the pump’s performance at 2,500 gpm is head 271 feet with an efficiency of 73 percent. Using the revised pump and control valve operating data, an energy cost balance sheet was developed for the closed bypass alternative (see Table 2). The results show an estimated annual cost savings of $16,684 if bypass control on the process pump is isolated.

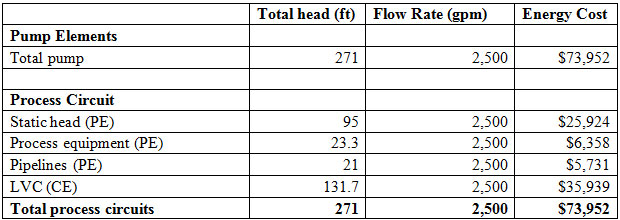
Table 2. The energy cost balance sheet for eliminating the bypass control on the process system

Reducing the flow rate through the pump to 2,500 gpm caused the process pump head to increase to 271 feet. This increase in pump head resulted in a differential pressure across the level control valve of 57 psi. With this new information, a second alternative involving isolating the bypass control valve (BPV) and trimming the impeller of the process pump to reduce the differential pressure across the Level Control Valve (LCV) is considered.

Discussions with the plant staff and the control valve supplier determined that proper level control could be maintained if the differential pressure across the LCV was reduced to 20 psid. The pump supplier was contacted and told the team that an impeller trim of 13.875 inches would result in a pump head of 186 feet at 2,500 gpm with a 20 psi drop across the LCV. Trimming the impeller would result in a pump efficiency of 79 percent. These new efficiency and pump values were used to calculate the costs of isolating the BPV and trimming the impeller. A completed energy cost balance sheet is shown in Table 3.

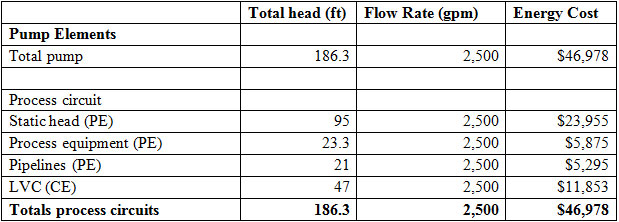
Table 3. Energy cost balance for isolating the BPV and trimming the process pump’s impeller

Another way to reduce the pump head is to install a VSD on the pump/motor combination. Installing a VSD requires the purchase of additional equipment, but it could also provide greater savings and increased operational flexibility.

The plant’s electrical and controls engineers evaluated installing a VSD with the manufacturer’s representative. The pump manufacturer was consulted to determine potential difficulties that would be encountered by installing a VSD. Once the team determined that installing a VSD was a viable option, an energy cost balance sheet was developed (See Table 4). With a VSD installed and set to control the level in the control loop’s destination tank, a pump speed of 1,416 rpm maintained the desired tank level. The plant decided to leave the existing control valve in place and fully open to minimize construction downtime.

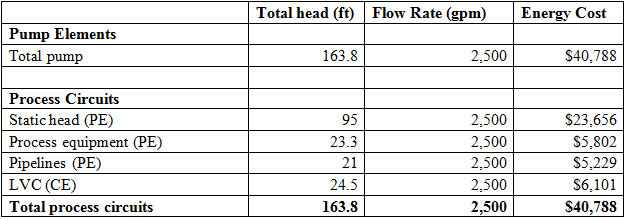
Table 4. Energy cost balance sheet for the system controlled by a VSD

With the changes in system operation, an alternative to purchasing a new pump to better meet the system’s existing needs was evaluated. The pump manufacturer was contacted and recommended a pump that was readily available, could be installed in the existing system with minimum modifications and had an 86-percent efficiency rating at 2,500 gpm. An energy cost balance sheet was completed showing the potential operating costs (see Table 5).

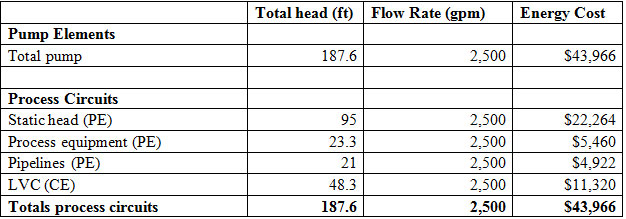
Table 5. Energy cost balance sheet for the system with a new, higher efficiency pump installed

July’s “Pumps System Improvement” will discuss how to evaluate the system in detail with a minimum of installed instrumentation along with the importance of cross validating the results.

Issue