
Last month’s column discussed the pre-screening process that identifies and prioritizes systems with a high probability of significant energy savings. After this process is complete, the actual system assessment begins. During the pre-screening process, readily available design and operating data are collected to help develop a priority. This column will follow the assessment of a system selected as a priority. A batch tank fill system had a high rating following the pre-screening because of the motor’s size, 150 horsepower (HP); the hours of operation (continuous); and the control method (on/off). A baseline for current operation is determined during the assessment. After this, the plant management team can identify improvement opportunities, decide on the viable options, determine the financial requirements of each option and develop an action plan. During the system evaluation, the assessment team will collect detailed system information, analyze how the system is currently operated, identify any potential existing problems and determine what plant operating data are needed to determine the operating cost. This column begins with developing a system description and determining how the system is currently operated.
System Description
The batch tank fill system was designed to stock a 60,000-gallon batch tank in 45 minutes. The system includes four batching tanks. Once they are filled, completing the batch process takes approximately three hours. After the batch process ends, the tanks are drained, and the fill process restarts. During operation, as one tank is filling, the three remaining batching tanks are in their batch operation. A 15-minute buffer was established in the filling process to provide the operators with an operating margin. The batch fill pumps (BTP-01 in Figure 1) start manually and are automatically shut down when the tank liquid level reaches the desired set point.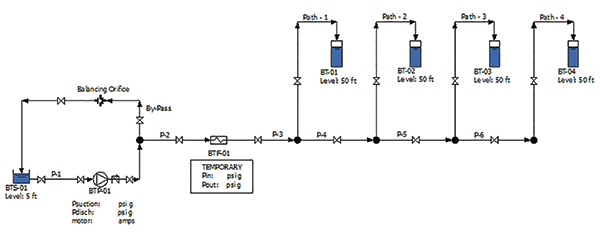 Figure 1. Piping schematic of the batch tank fill system with the data collection needs displayed (Graphics courtesy of the author)
System Walk-Down
During the system walk-down, the assessment team completes the following tasks, which may be assigned to different members of the assessment team:- Identify the equipment in the system
- Establish the system boundary
- Determine the accuracy of the piping system schematic
- Assign the instrumentation required for the assessment
- Develop the test method
Walk-Down Results
This section includes the information collected during the walk-down process for the batch pump system. The assessment team discussed the information collected, beginning at the supply tank and working toward the batch tanks. Each component’s function was defined:- Batch supply tank (BTS-01)—This supply tank provides the source of the fluid for the batch pump. The bottom of the batch supply tank has a datum elevation of 100 feet with an operating level of 5 feet. The supply tank is filled by the plant’s recycle water system. After reviewing plant operating data, the liquid level in the batch supply tank is maintained at a constant level of 5 feet.
- Pipeline P-1—This pipeline connects the supply tank to the batch pump. It is approximately 50 feet long and has two gate valves installed along with a flush entrance from the tank to the pipeline. The suction pipeline is a 6-inch, schedule 40 steel pipe.
- Batch pump—The batch centrifugal pump is driven by a 150-HP motor. A manufacturer’s pump curve is available, and the nameplate on the installed pump matches the design documents. The following information was taken from the motor nameplate: efficiency 94 percent, power factor 0.85, voltage 480, speed 1,775 rpm.
- Pipeline P-2—This pipeline connects the batch pump to the process equipment. The pipeline is 200 feet long and is a 6-inch, schedule 40 pipe with two gate valves and a check valve installed.
- A bypass pipeline—This pipeline is from the common discharge header to the batch supply tank. It provides minimum flow through the batch pump. The bypass line is a 4-inch, schedule 40 steel pipeline 300 feet long that runs from the pump discharge header to the batch supply tank. A balancing orifice is installed in the bypass to limit the flow rate to 500 gallons per minute.
- Process equipment (BTF-01)—This item is used in the batch fill system to clean and precondition the water going to the batch tanks. The manufacturer of this device provided a pressure drop versus flow rate graph for the equipment.
- Pipelines P-3 through P-6 and Path 4 through 6—Each is a 100-foot long, 6-inch diameter, schedule 40 steel pipe with a gate valve installed.
- The batch tanks (BT-01 through BT-04)—Each tank has a capacity of 60,000 gallons. The base of each tank is located at a datum elevation of 125 feet. They are filled from the top, with the fill port located 175 feet above the reference elevation. Once the tank is full, it is isolated from the fill system and the three-hour batch process begins.
Assessment Method
The objective of the assessment is to determine a baseline for energy usage and operating costs for the existing system. This requires the collection of plant operating data and defining the plant’s operating instrumentation needed for data collection. Referring to the system diagram, the assessment team identified the existing instrumentation and determined the need for additional devices. At all times, the level in the batch supply tank is maintained at a constant level of 5 feet, and a level indicator on the tank appeared to be operating properly. This level in the batch supply tank defines the system boundary and provides the starting energy value. The batch pump has installed suction and discharge pressure gauges. The discharge pressure gauge appeared to be operating normally, but the suction gauge was inoperative. A work order was submitted to return the gauge to service. The differential pressure across the pump with the manufacturer’s pump curve provided a method of calculating the power used by the pump and can be used to cross validate the flow rate through the system. Voltage and amperage readings are available for the drive motor and can be safely observed. This allowed for an independent calculation of the electrical power consumed by the motor, which can be used to cross validate the energy supplied to the system. The differential pressure across the process equipment (BTF-01 in Figure 1, page 20) can be used to determine the flow rate through the system using the manufacturer’s differential pressure values. Because a flow meter was not installed in this circuit, pressure gauges were added on the BTF-01 vent and drain lines to arrive at a differential pressure. This data will indicate a flow rate that can be used to cross validate the system flow rate. Each of the batch tanks has a 60,000-gallon capacity. Knowing the tank capacity and the time needed to fill the tank with the batch pump allows the flow rate through the system to be determined. Because the fill port for each tank is located at the 175-foot elevation and the fluid drops into the tank, the systems static head remains constant during the filling operation. Because the pump is continually operating, instead of being turned on and off to fill the tank, the assessment must look at the batch tank filling operations and the minimum flow recirculation back to the batch supply tank.Performing the Assessment
Following the walk-down, the assessment can be scheduled so that it does not interfere with normal plant operation. This assessment can be conducted with a limited number of operators. Before the assessment, the plant operators and the personnel collecting the data are briefed, so they understand the test method and data-collection process. The data collection begins when the batch pump starts the fill operation and ends when the next filling operation starts. Because the path to BT-04 is longer than the path to BT-01 (see Figure 1), the assessment team decided to evaluate the system under these two operations. The system data is collected every 10 minutes, along with operating data for the bypass circuit once the system enters bypass mode. Table 1 shows the data collected when filling BT-04, and Table 2 lists the results when filling BT-01.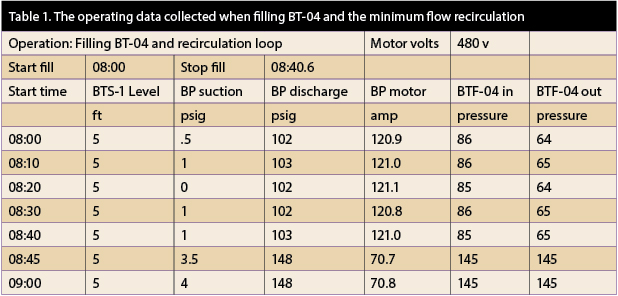 Table 1. The operating data collected when filling BT-04 and the minimum flow recirculation
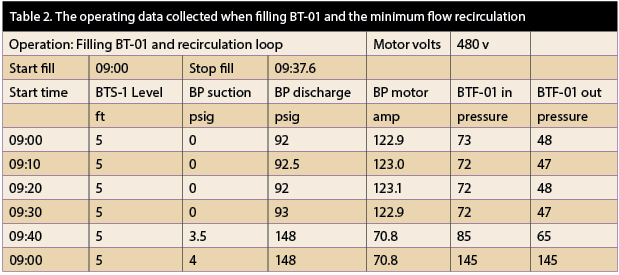 Table 2. The operating data collected when filling BT-01 and the minimum flow recirculation