

It is said that the top failure of pumps is a seal failure. The root cause of seals failing is often deflection or vibration of the pump shaft. The most common causes behind pump shaft vibration include:
- Design: not running at best efficiency point (BEP) due to over/undersizing or process variation and variable speed drives (VSDs)
- Installation: pipe strain, pipe resonance, misalignment, thermal growth or poor foundation
- Operations: dead heading pump, starving pump or incorrect header operation
- Process: plugged strainers, plugged filters, over pressure, debris in-line
- Lubrication: washout, contamination, lack of proper lubrication
- Wear out: bearing, impeller, case clearances
If the common failures can be detected and eliminated or if the most frequent causes can be reduced, then there will be an improvement in pump reliability and pump life length. Pump reliability is often measured in meantime between failure (MTBF). An increase in MTBF indicates an improvement in pump life and an improvement in plant reliability. It is common today for a pump designed for a 20-year life to last five to seven years.
Multiple industry studies suggest that the most common cause of failure for rotating equipment, like pumps, is due to poor lubrication practices.
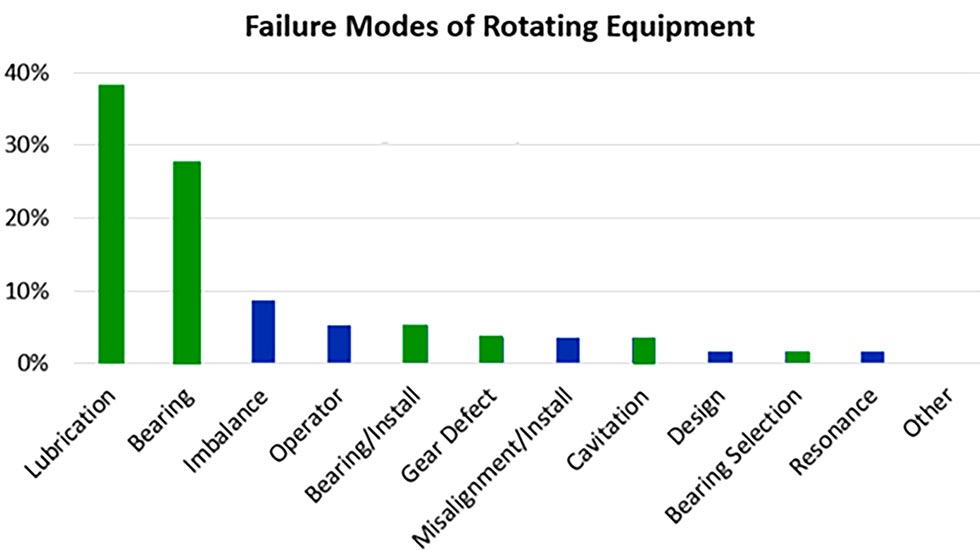 IMAGE 1: Most common failure modes of rotating equipment through study of United States Midwest manufacturing plants (Images courtesy of ATEK)
The data from a study of U.S. Midwest manufacturing plants (Image 1) shows that of 100 failures, 67 will be due to lubrication or bearing defects. Each green bar in the chart indicates a defect that is detectable using ultrasonic, while each blue bar in the chart indicates a defect that is detectable using vibration.
Totaling the vibration or blue bars first shows 16 of 100 failures are detectable by vibration—not a good showing.
A monitoring program focused only on vibration can yield a 16 percent early detection rate of failures, while using ultrasonic with vibration monitoring may yield an early detection rate nearing close
to 100 percent.
The same study looked at using traditional vibration monitoring with baseline and alert setting techniques. It found that of 100 assets, seven faults were detected, while 28 pre-existing faults would progress into failure being detected late or not detected at all.
Twenty-six of the 28 pre-existing faults were lubrication and bearing defects that were detected by ultrasonic sensors.
ISO 10816 & ISO 29821
Vibration monitoring has been around for more than 30 years and information is available to understand how much vibration is too much for each type of asset, including pumps, fans, large and small pipes, bridges, etc. Refer to ISO 10816 for more information on vibration monitoring for machinery.
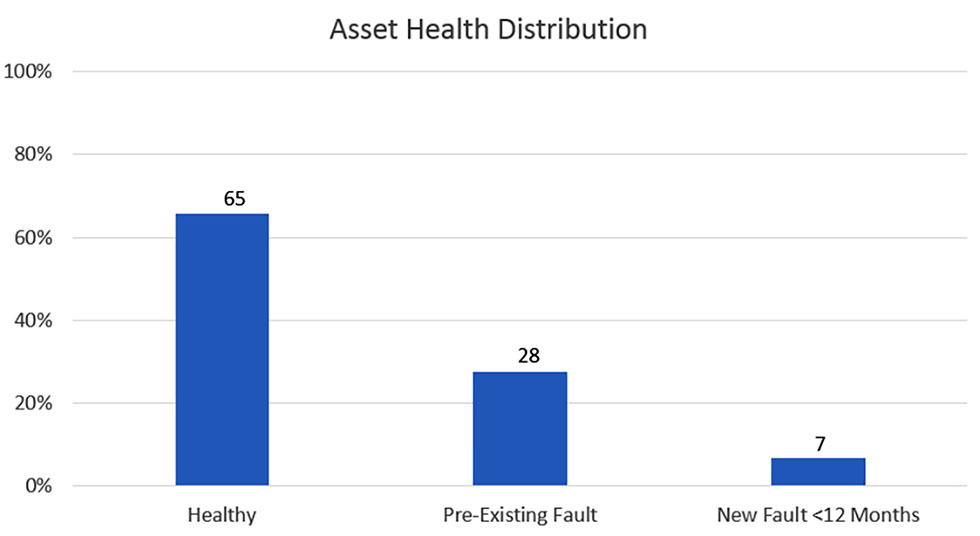 IMAGE 2: Pre-existing faults chart from Midwest manufacturing plants study
Ultrasonic has also been around for 30 years; however, it initially focused on thickness testing, then leak detection. More recently, it has been used for mechanical and electrical failure detection. ISO 29821 is the standard for ultrasonic condition monitoring of machines. The standard is rich with information, but it does not have the maturity of vibration monitoring when it comes to a measurement standard or an alert standard. Several companies have well-established information for setting alerts for ultrasonic measurements.
Insights From Manufacturing Study
The good news is that 67 percent of failures are caused by just two conditions: lubrication and bearing defects. Focusing on automated detection and remedy of these two faults should provide a return on investment for the industrial plant.
Lubrication Fault Detection
Lubrication faults are identified in the frequency range between 4,000 to 25,000 hertz (Hz). The higher end of this range is referred to as ultrasonic. The energy in a lubrication fault is broad spectrum or present across many frequencies. One way to describe the data of a lubrication fault is a raised noise floor, or a haystack, since the energy shown in the spectrum tends to look like noise along the floor or bottom of the chart, or like a stack of hay with a random-looking mound.
Although each haystack may be different for different bearings, the common aspect is that lubrication faults consistently present themselves in the 4,000 to 25,000 Hz frequency range, which is best detected by an ultrasonic sensor. In contrast, a typical vibration sensor monitors a frequency range between 2 to 1,000 Hz, and, thus, is less likely to see lubrication faults present in the higher frequencies.
To illustrate the point, Image 2 is a case example showing a lubrication fault. A few points of interest include:
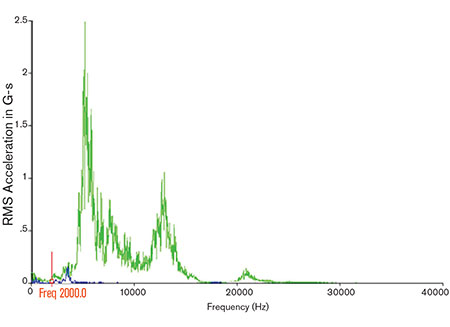 IMAGE 3: Spectrum of a roller element bearing lubrication fault
- the green line is a lubrication fault
- the blue line is a healthy bearing
- the red mark on the X-axis shows the 2,000 Hz mark
What this means is that a lubrication fault requires a high-frequency sensor for detection and that a 2 to 1,000 Hz vibration sensor will not detect this fault, which is widely understood to be the most common root cause of failure in industry.
Ultrasonic has become a feature of vibration monitoring. Technology is available that measures vibration and ultrasonic energy in one sensor.
Bearing Fault Detection
The second-most common failure mode is bearing failure. Bearing faults can be identified using either vibration or ultrasonic sensors. Using a 2 to 1,000 Hz vibration sensor, a trained and experienced vibration analyst can review the vibration data in a spectrum chart and identify bearing faults. In contrast, using ultrasonic, some vendors have automated the detection of bearing defects and include a severity scale to define priority of the repair.
The automated detection does not identify the difference between an inner or outer race defect like what is possible in a spectrum analysis. However, for many industrial plants, the next action as a result of identifying either bearing defect is the same, “change the bearing.” The recent shift in technology development by the internet of things (IoT)-focused companies is on being intuitive, easy to deploy and cost effective to meet return on investment requirements for general purpose pumps.
Automated Recommended Next Action
With the end in mind, the ultimate destination for any monitoring or information system is to create insight that results in a decision and productive action. A common pitfall for monitoring systems is the lack of clear action tied to each alert. With smarter sensors and systems, this pitfall is being addressed.
Monitoring systems today include several layers of filtering to eliminate nuisance alerts, thus raising the credibility of the remaining alerts and clearly defining recommended next actions so they can be managed appropriately.
Using both vibration and ultrasonic measurements, a concise decision-tree is used to create context-based
recommended next actions. For example, if a minor ultrasonic alert is detected, then the recommended next action is to “field inspect and lubricate” that bearing. If a minor overall vibration alert is detected, and it is a pump, then a recommended next action is to “field inspect for looseness and inspect the operating parameters of the pump.”
Keeping the decision-tree concise allows the model to be relevant and extensible across a broad range of assets and applications.
By bringing the right data to the right person at the right time, automation can be used to complete mundane work and free up humans to do the high-intelligence, problem-solving tasks.
