As energy costs continue to rise and environmental concerns drive sustainability efforts, optimizing industrial pump performance has become critical. This case study details how a comprehensive pump performance monitoring program using sensorless technology not only diagnosed key inefficiencies in a pump system but also identified a cost-effective solution with significant energy savings. By analyzing data from a 110-kilowatt (kW) pump operating far from its best efficiency point (BEP), the study demonstrates the benefits of an integrated monitoring approach that combines electrical signature analysis (ESA) with AI-based predictive maintenance algorithms.
By installing hardware solely at the motor control center (MCC) panel, this method eliminated the need for traditional flow and pressure sensors while delivering real-time insights into efficiency, mechanical health and operational risks like cavitation. The findings guided the selection of a more suitable pump, showcasing how data-driven decisions can enhance sustainability and reduce costs.
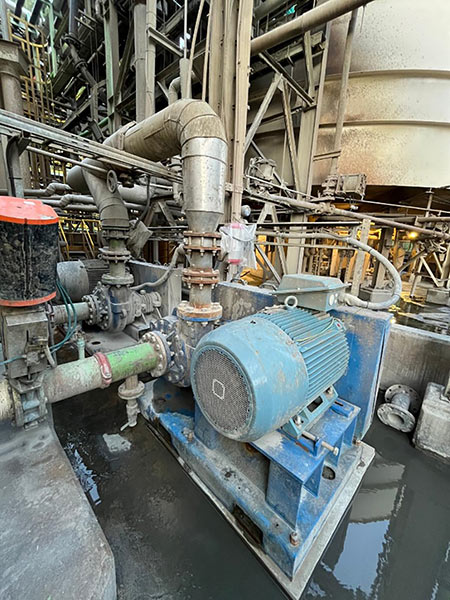
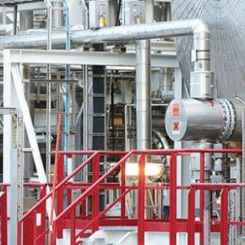
The Existing System: Identifying Inefficiencies
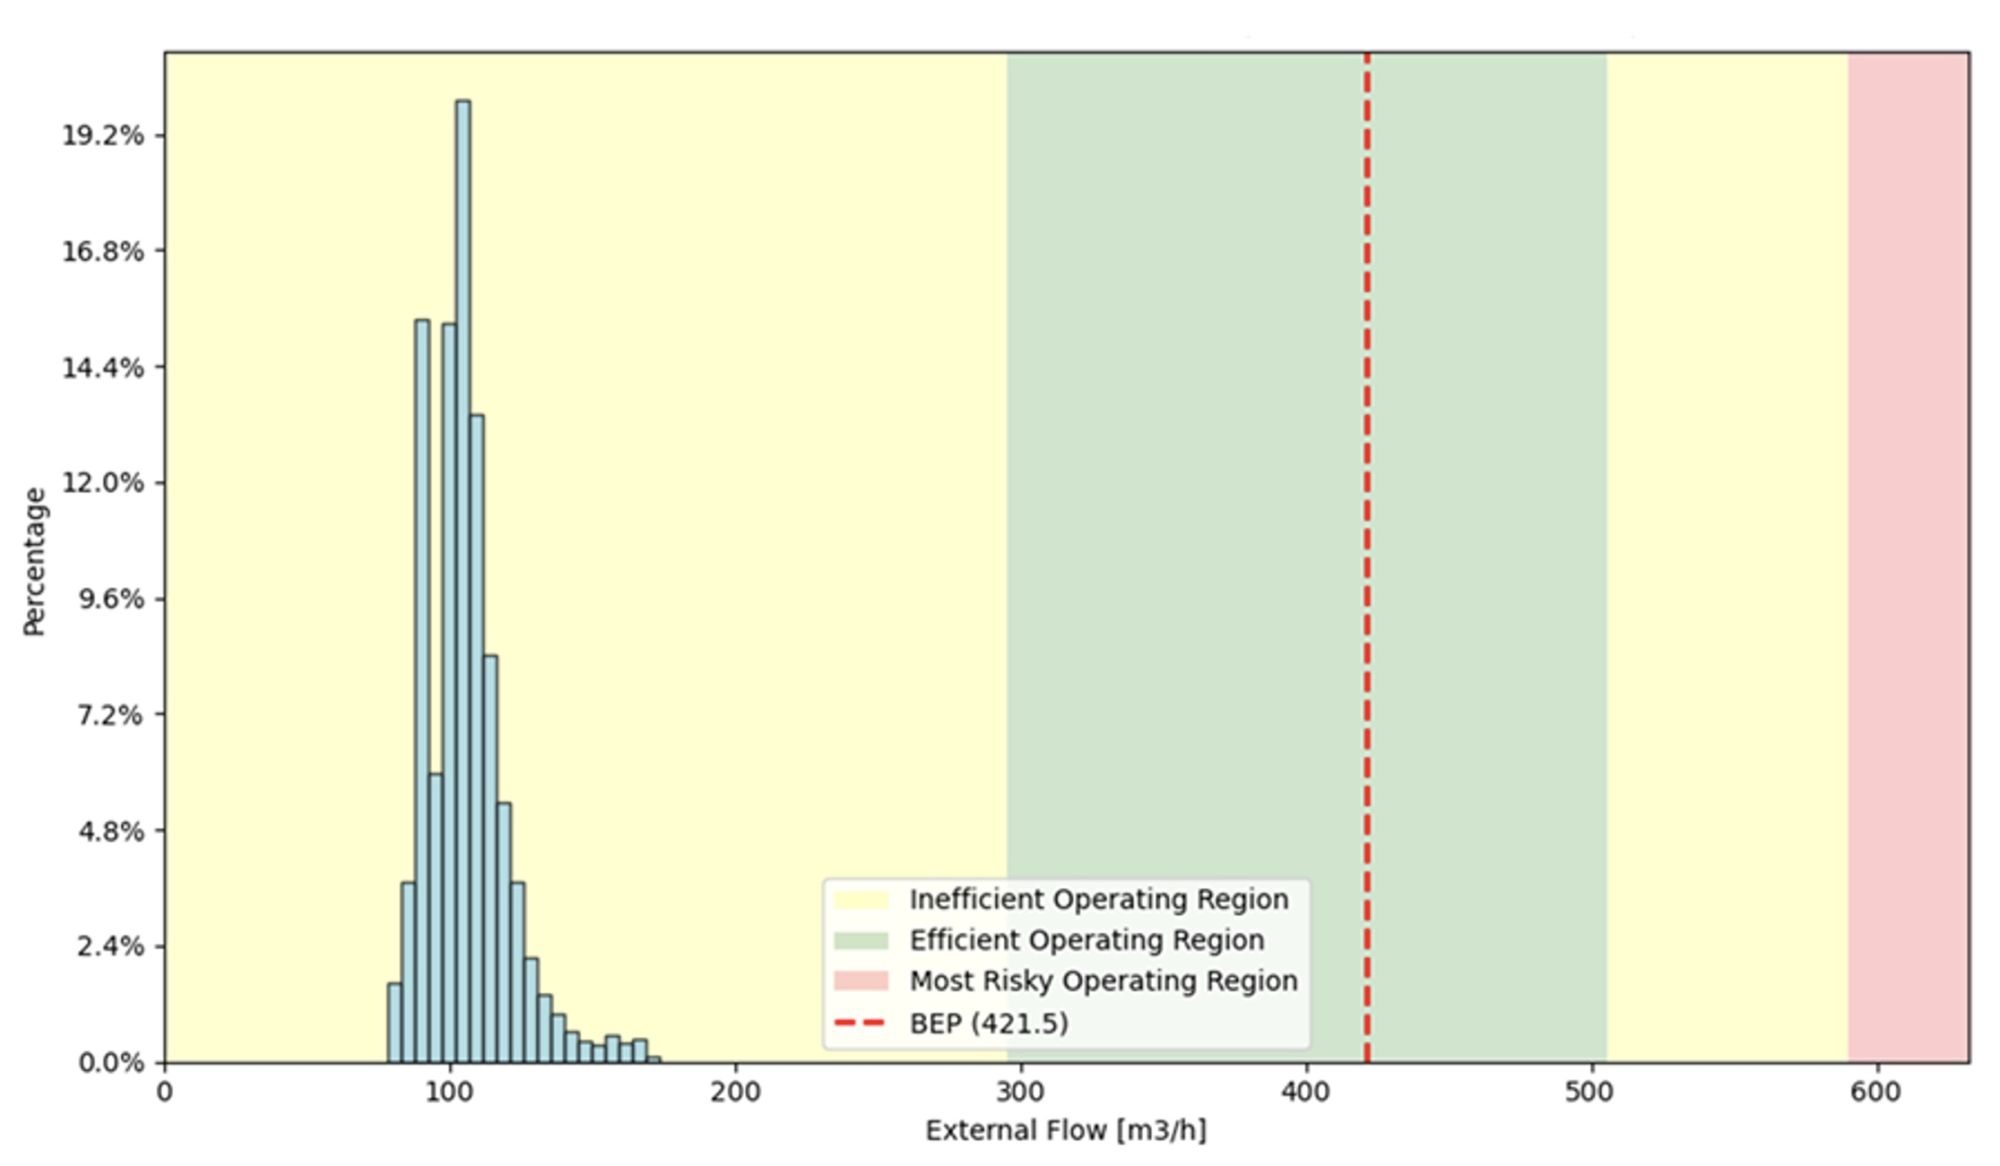
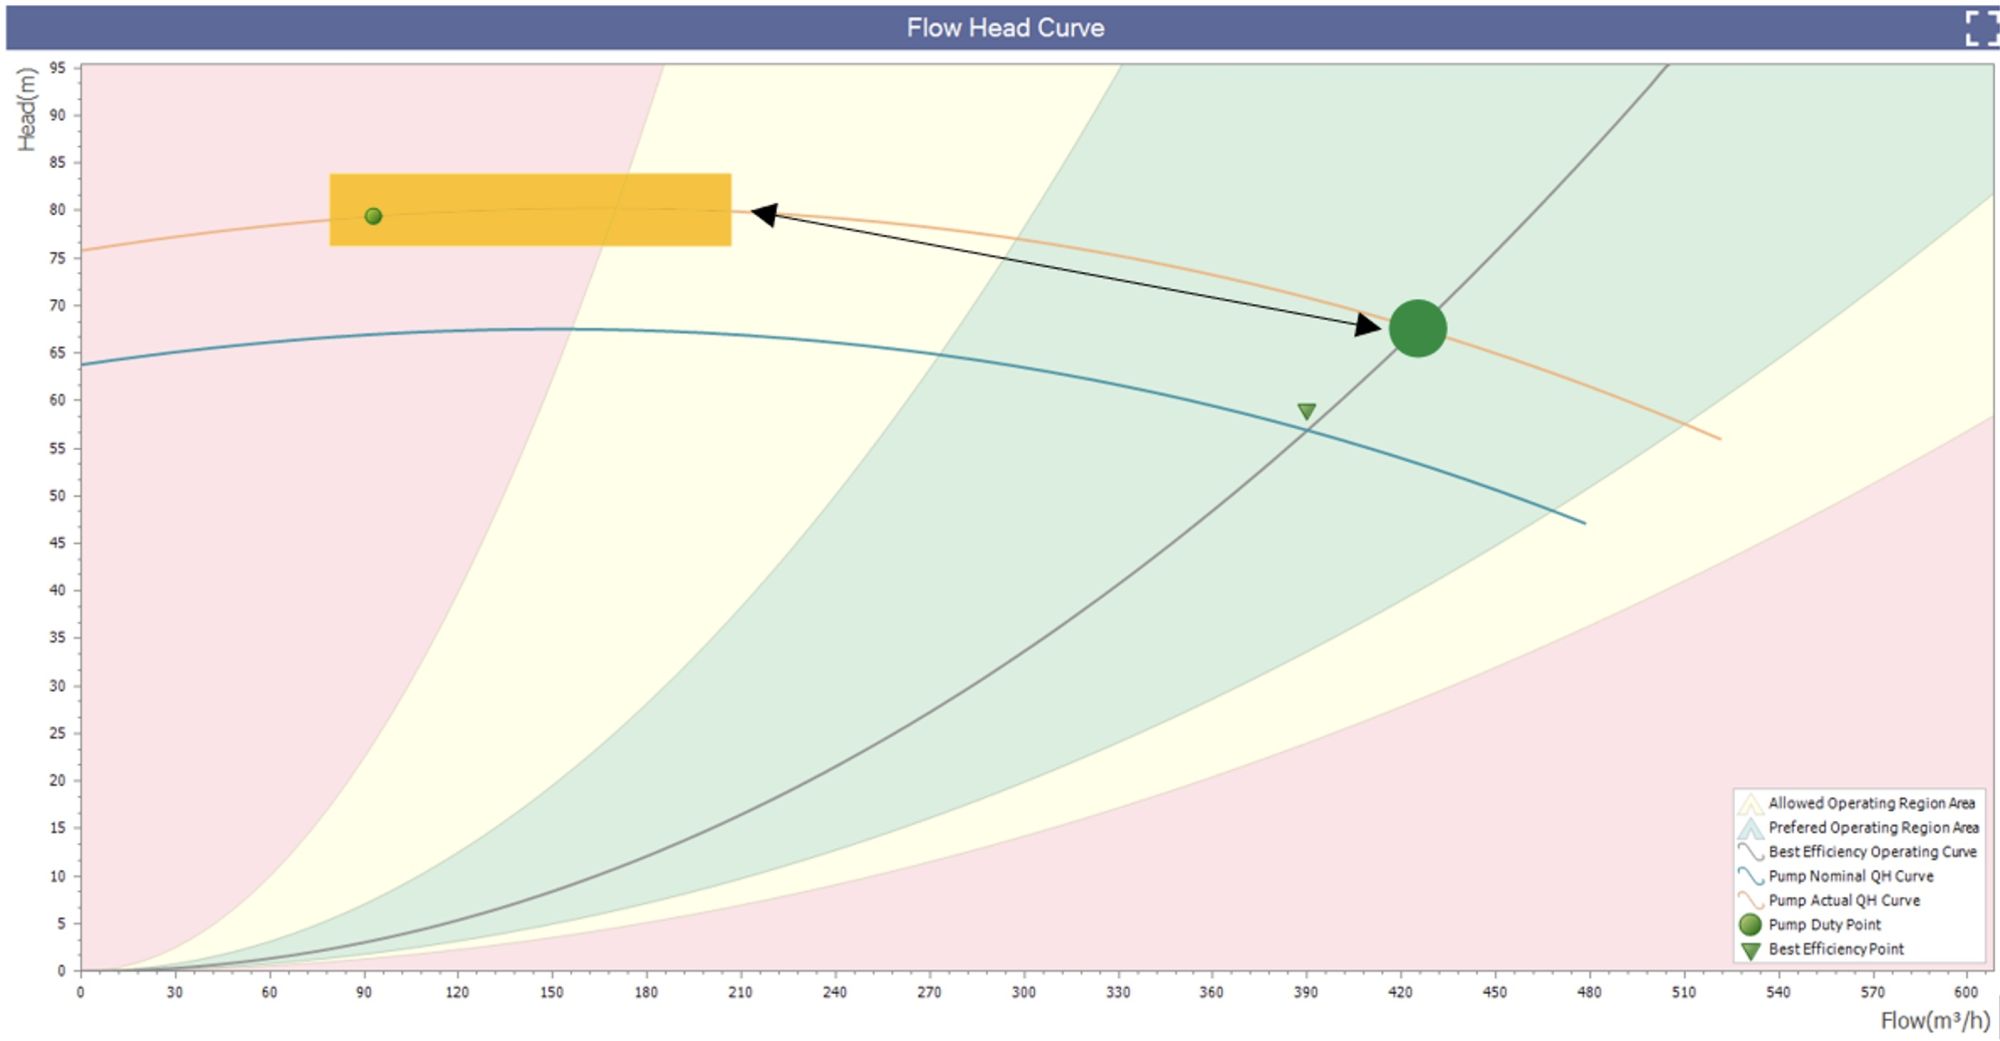
The pump under review, a process water unit with a 110 kW motor, was designed for a nominal flow of 421.5 meters cubed per hour (m³/h) at its BEP. The installed continuous monitoring ESA system, however, revealed it frequently operated at 90-115 m³/h—well below its optimal range. This mismatch, common in oversized legacy systems, resulted in efficiencies between 40% and 60%, with annual energy consumption reaching 602,880 kilowatts per hour (kWh).
Several issues compounded the inefficiency. A belt-and-pulley drive system, increasing shaft speed from 1,480 rotations per minute (rpm) to 1,630 rpm, added a 2% energy loss. More critically, operating outside the BEP heightened cavitation risk, as shown by broadband noise in the power spectral density (PSD) analysis. This noise signaled flow irregularities, leading to mechanical stress, vibration and potential damage to bearings and seals.
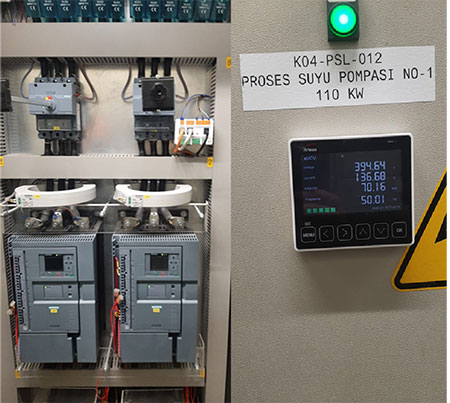
Sensorless Monitoring Methodology
In order to evaluate the system, ESA was implemented using a device installed at the MCC panel. This system measured motor electrical signals—voltage and current—to calculate flow, pressure and power without requiring external sensors on the pump or piping. The hardware interfaced directly with the motor’s power supply, simplifying deployment by avoiding additional instrumentation. This approach provides several advantages:
- Unified data collection: By gathering data directly from the motor control panel, the system eliminates the need for separate flow or pressure sensors.
- Predictive maintenance: Using advanced AI algorithms, the software delivers early warnings for issues such as low efficiency, low flow, temperature risk and cavitation, thus allowing for proactive maintenance.
The combination of sensor data (when available) with the estimation algorithm provides a robust solution for continuous performance monitoring. This methodology simplifies the monitoring process, reduces the reliance on costly physical sensors and delivers accurate performance assessments even in challenging operational conditions.
Analysis of Current Pump Performance
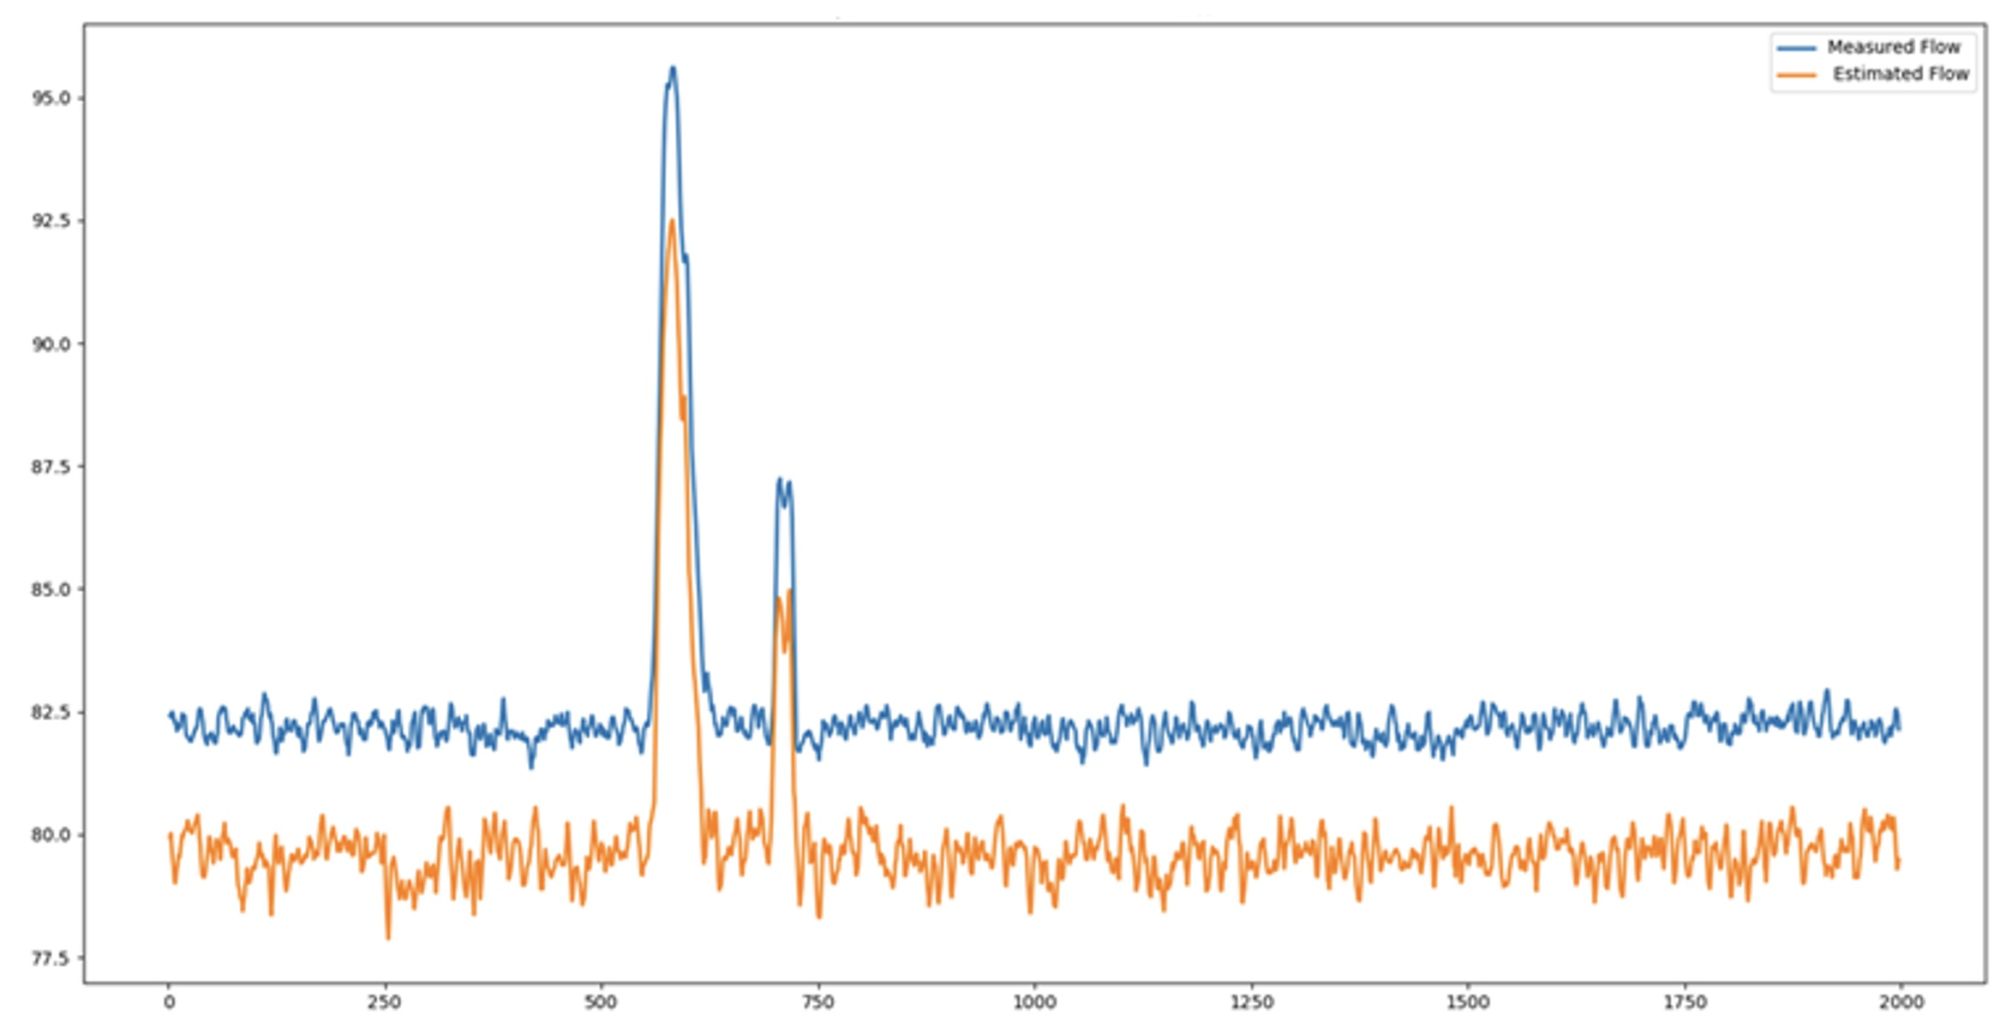
The ESA system incorporated AI algorithms to process electrical signals and estimate operational parameters. These algorithms correlated signal patterns with hydraulic performance, enabling flow and pressure predictions with a deviation of ±3% compared to on-site sensor data during validation. Beyond performance metrics, the AI analyzed signal anomalies to identify mechanical conditions, such as cavitation or bearing stress, by detecting irregularities like sideband noise in the PSD. The software presented data through graphical outputs—flow-pressure curves plotted actual operation against the BEP—with zones delineating efficient and inefficient regions. Power curves showed energy consumption across flow range, and time-series trends tracked 24-hour and annual performance. These tools provided a detailed diagnostic framework for assessing pump behavior.
Analyzing Energy Consumption & Mechanical Health
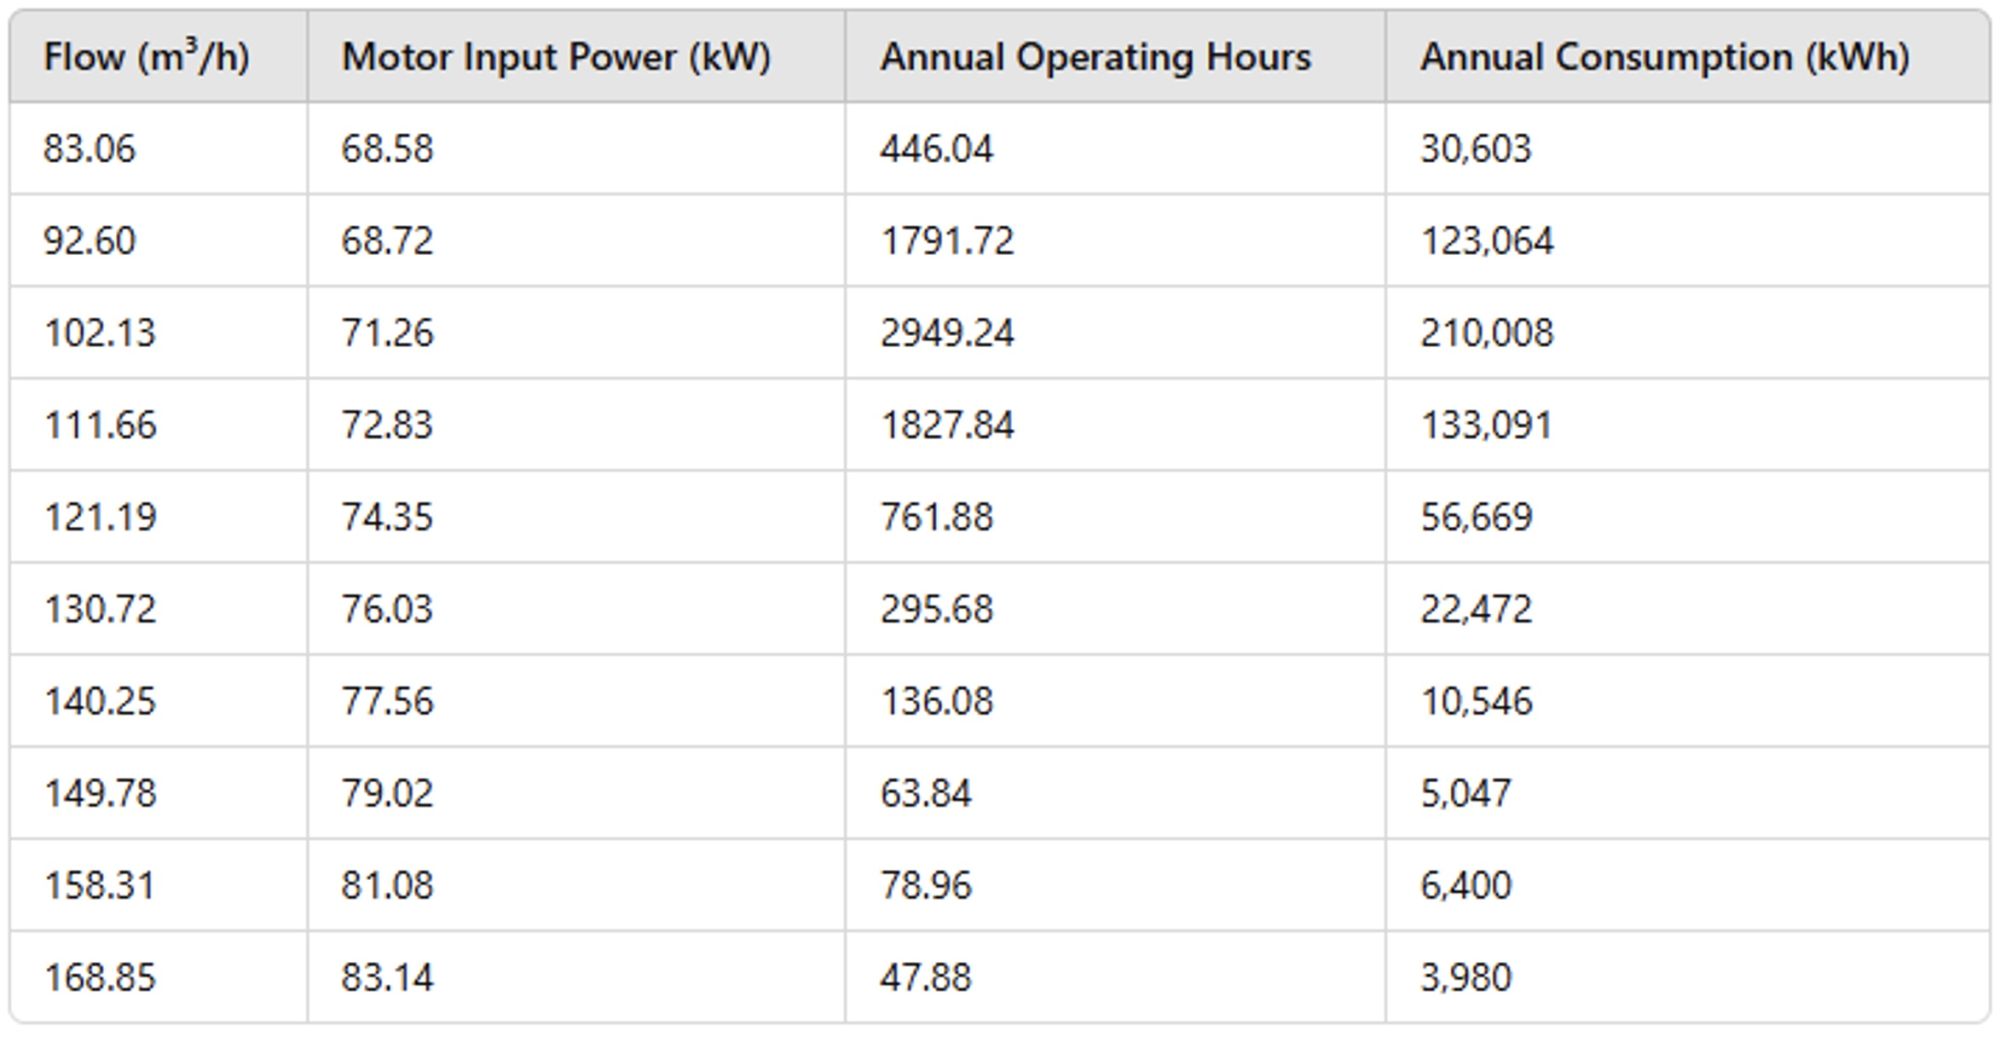
Operational data over one year revealed energy consumption patterns at various flow rates. At 83 m³/h, motor input power was 68.58 kW, rising to 83.14 kW at 168 m³/h. The low-flow bias—concentrated at 90-115 m³/h—drove inefficiency, with total consumption reaching 602,880 kWh annually.
Mechanical analysis identified the following risks:
- Low efficiency: Operating away from the design curve leads to increased energy usage and reduces overall system efficiency.
- Cavitation risk: The low-flow, high-head conditions increase the risk of cavitation—a phenomenon where vapor bubbles form and collapse in the pump, potentially causing significant mechanical damage.
- Component wear: Elevated operating stress due to improper flow conditions accelerates wear on critical components such as bearings and seals, which can lead to more frequent maintenance and potential downtime.
These findings indicated a mismatch between the pump’s capacity and system demand, necessitating a reassessment of equipment sizing.
Alternative Pump Selection & Performance Optimization
To address these inefficiencies, an alternative pump model was evaluated. Key technical improvements include:
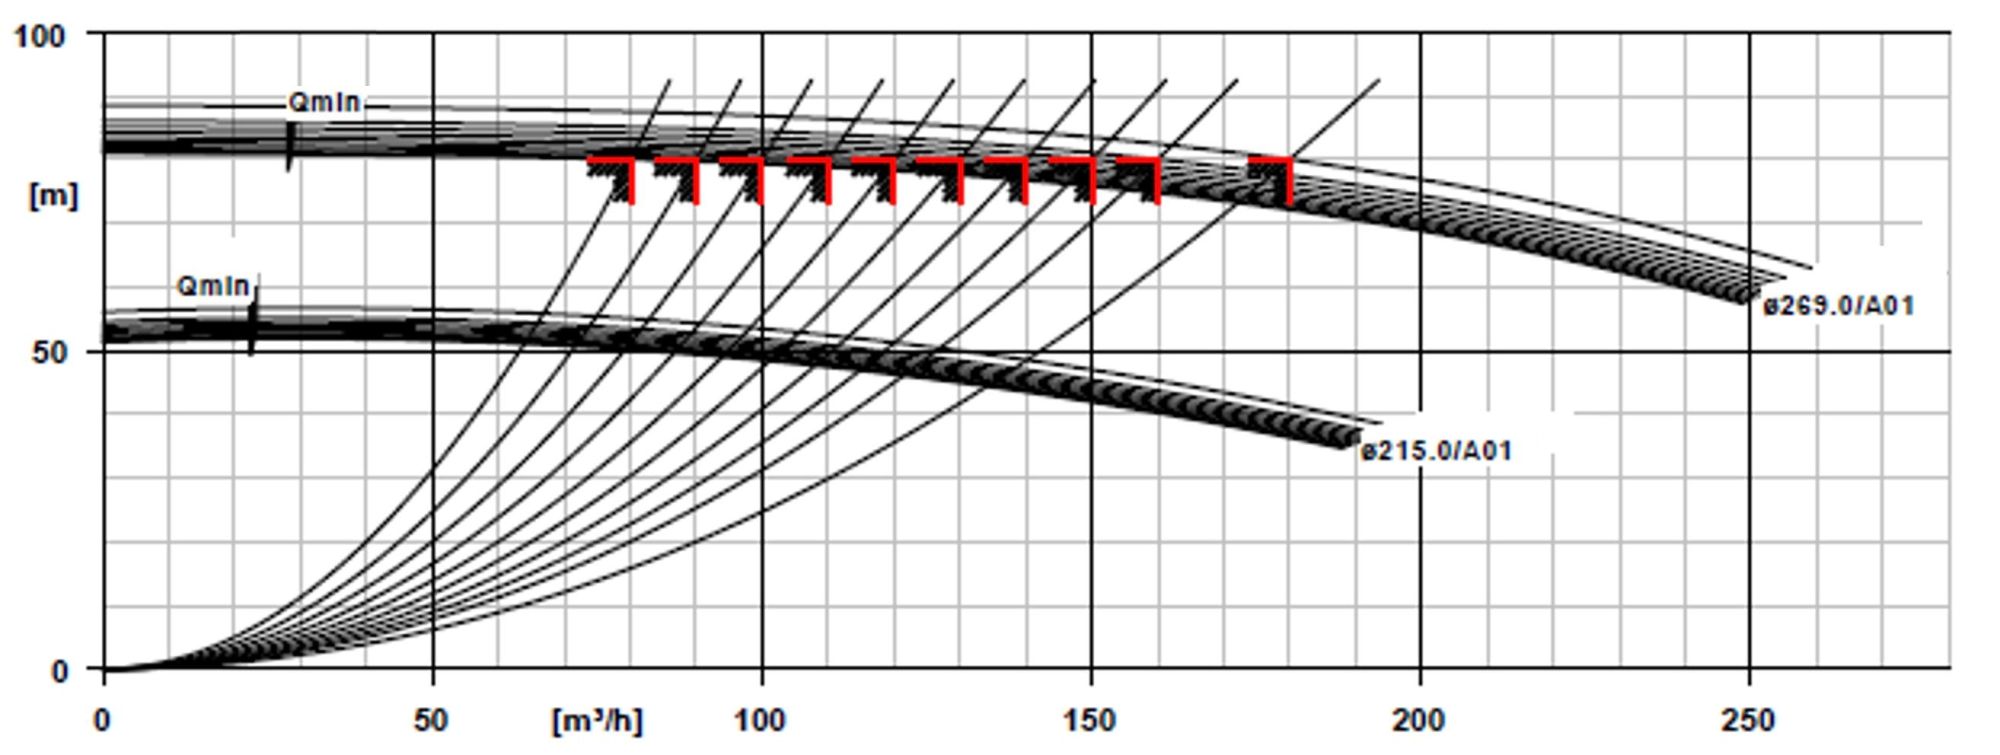
- Improved flow and efficiency: The alternative pump has a nominal flow rate of approximately 215 m³/h and a nominal power consumption of 55 kW. At its BEP, it operates with an efficiency of around 81.3%, a significant improvement over the current pump.
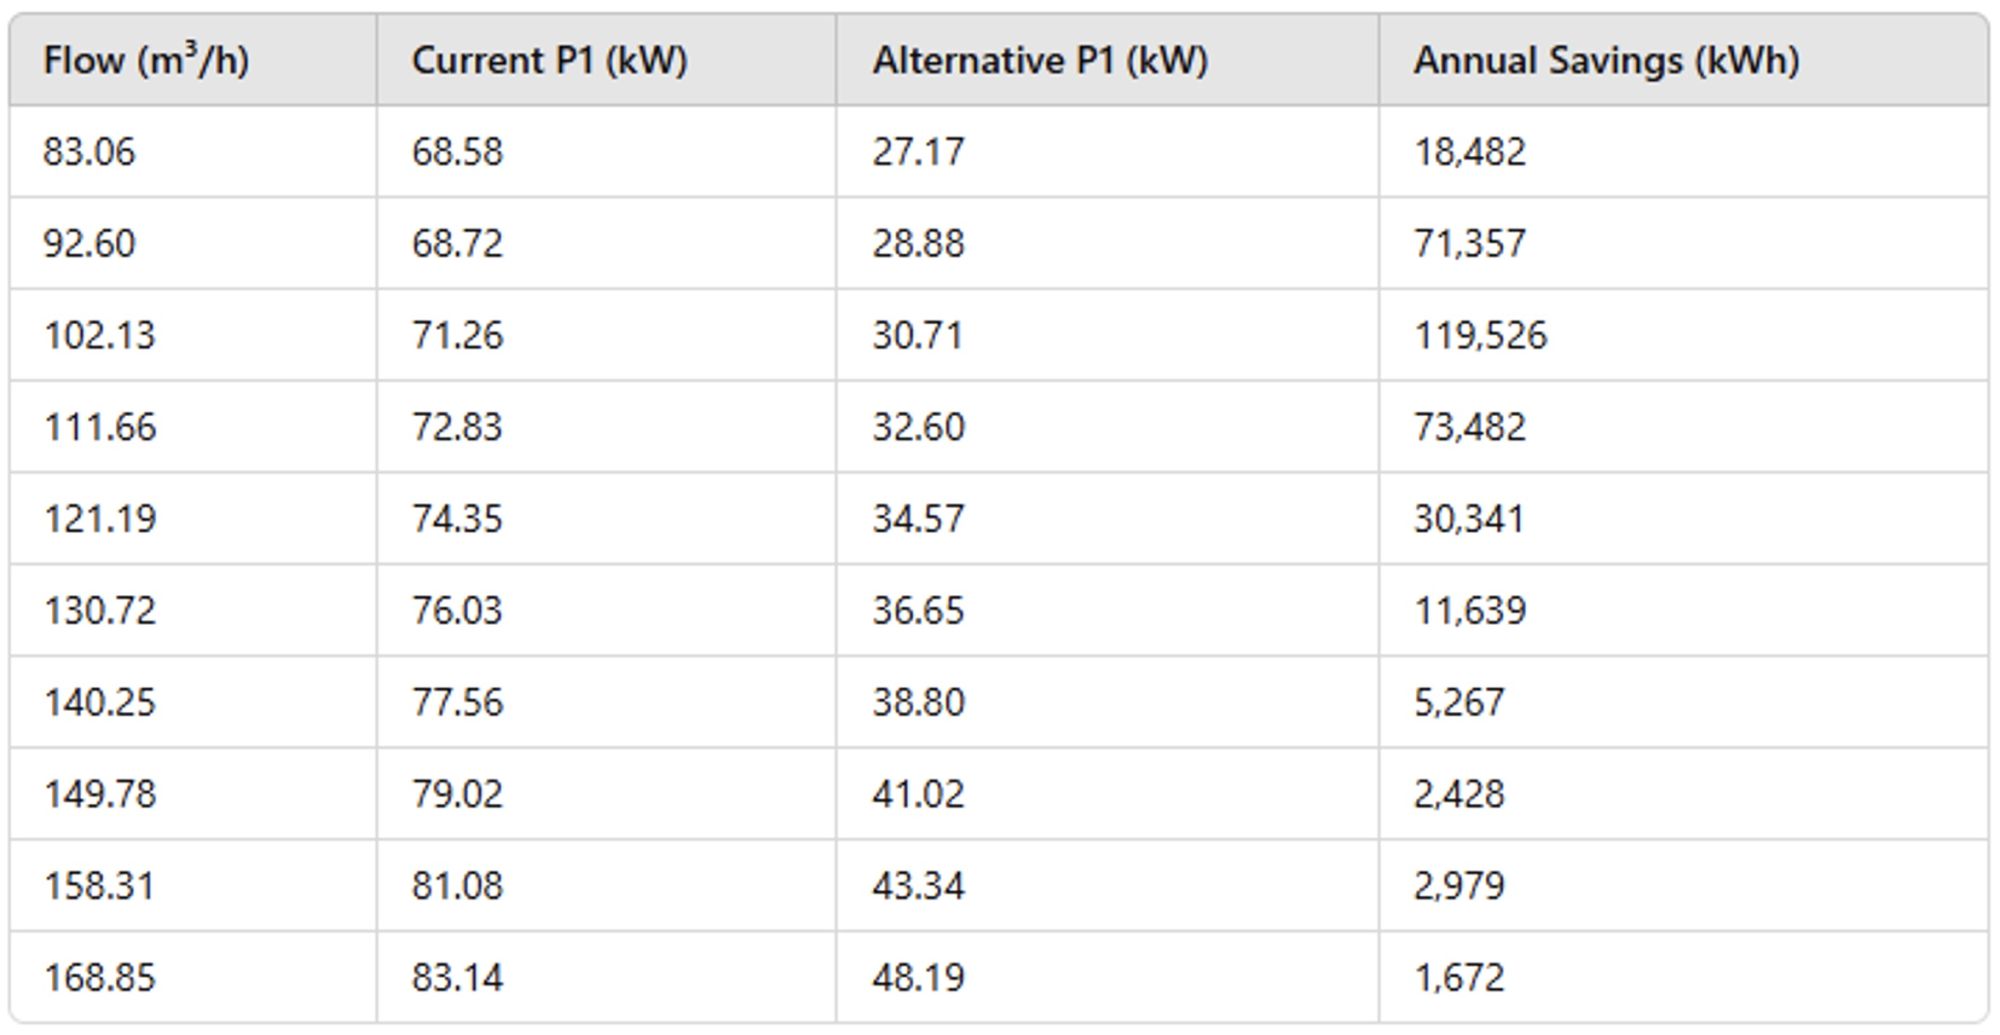
- Energy savings: With the alternative pump, the projected annual energy consumption drops to approximately 264,707 kWh. This represents an energy savings of roughly 338,173 kWh per year—a reduction of over 56%.
- Enhanced operational flexibility: Integration with a variable frequency drive (VFD) allows for speed control based on operating conditions. Adjusting the pump’s speed to match the required flow further optimizes efficiency and reduces energy consumption across varying load conditions.
The performance data clearly indicated that a switch to the alternative pump would not only resolve the issues related to low efficiency and energy waste but also extend the equipment’s operational life by reducing mechanical stress and wear.
Economic & Technical Outcomes
The alternative pump and VFD required an estimated investment of $39,000. With energy savings of 338,173 kWh annually—equivalent to $30,435 at $0.09/kWh—the payback period was 1.28 years, with a simple return on investment (ROI) of 78%.
Additional benefits included:
- Reduced downtime: Early fault detection was achieved via MCC-based monitoring.
- Environmental impact: Lower energy use reduced the carbon footprint.
- Scalability: The sensorless approach could be replicated across other pumps on-site.
Implementation & Validation
A key aspect of this case study was the validation of the sensorless monitoring approach. Side-by-side comparisons between traditional flow sensor data and the values estimated by the pump performance analysis software showed a high degree of accuracy, with deviations of only around ±3%. This close alignment validates the effectiveness of the sensorless approach and underscores its potential as a reliable alternative to conventional monitoring systems.
This case study underscores the importance of integrating advanced monitoring techniques into pump operations. The key takeaways include:
- Comprehensive monitoring: The sensorless monitoring system offers a unified and accurate method to track pump performance and condition without the need for expensive physical sensors.
- Efficiency improvement: Operating a pump outside its BEP not only wastes energy but also increases wear and tear. Optimizing pump selection and integrating speed control mechanisms can lead to energy savings and operational improvements.
- Economic viability: With an ROI of 78% and a payback period of just over one year, the financial benefits of upgrading to a more efficient pump system are clear.
- Sustainability: Reduced energy consumption lowers operational costs and contributes to environmental sustainability by decreasing the carbon footprint.
For operators and engineers seeking to improve pump system performance, the lessons from this study are clear. Regular performance monitoring—especially when combined with sensorless technologies—can identify inefficiencies early and guide the selection of more appropriate equipment. By addressing issues such as low efficiency, cavitation risks and component wear, companies can achieve cost savings and support long-term sustainability goals.
For more on condition monitoring, visit pumpsandsystems.com/tags/condition-monitoring.