

At 10% over maximum allowable working pressure (MAWP), users may have a ruptured disc or relief valve open. If users are operating close to MAWP, consider that surge pressures, pump start pressures, pump control valve closing pressures and pressure fluctuations may occur due to changes in pump frequency drives, unstable flow conditions from control valves and thermal expansion.
The first step is to identify the pressure spikes during events that reach MAWP. If users are exceeding MAWP, monitor the system pressure at 200 times per second (many pumping and piping systems are monitored at one time per second). Standard process pressure transducers do not record pressure transients traveling 4,000 feet per second through a piping system.
When monitoring pressures at 200 times per second to record pressure transients, consider systems that also record a running average while in a steady state to keep data files manageable. If the pressure fluctuations were minimal, the system would record a running average of 10 data points per second.
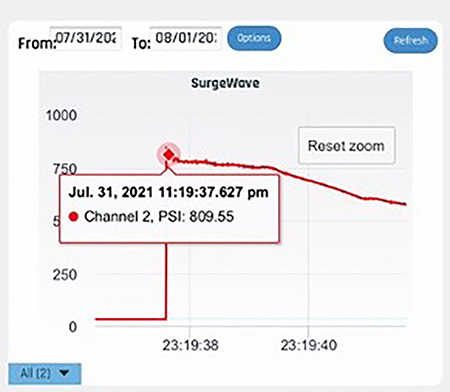
Where should the pressure be monitored? Start with upstream of the pump, upstream and downstream of the check valve, and upstream and downstream of control valves. Install a pressure monitoring system at some point downstream to verify wave speed and initiation of the pressure wave. Image 1 shows the pump discharge pressure startup surge. The piping system is designed to 300 pounds (lbs) American National Standards Institute (ANSI) with a maximum allowable pressure of 740 pounds per square inch (psi), the pump startup surge pressure is over 800 psi.
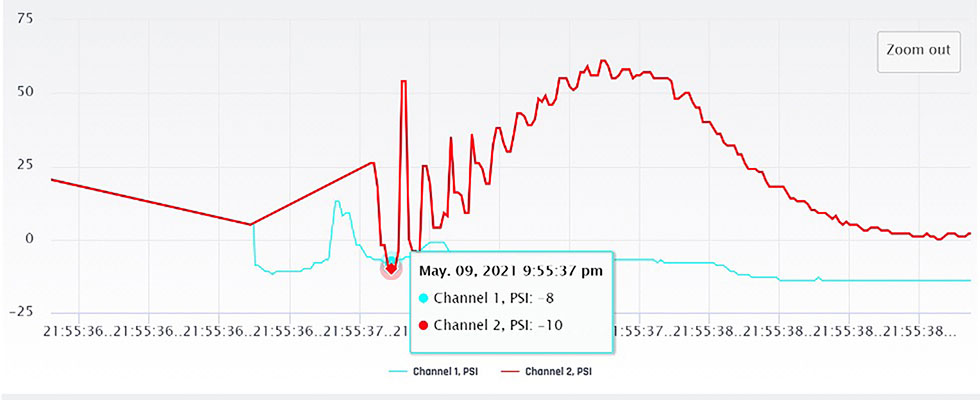
Image 2 shows the reversal of flow through a check valve. The pump was operating in steady state with a pressure of 70 psi. When the pump was de-energized, the change in velocity created a negative wave which then reflected back positive. The check valve was still open when the positive wave hit the check valve disc, allowing the flow to reverse. When the check valve closed, there was another upstream in pressure followed by a negative pressure wave. The pressure in the piping system dropped to -10 pounds per square inch gauge (psig).
Now that a pressure transient has been recorded, the next step is to model the pumping and piping system to simulate the change in velocity that is creating the damaging pressures. Surge modeling software allows users to input pump curves, pipeline size, elevations, pipe diameter and pipe material.
What other piping components can create a change in velocity in a system? Surge modeling software provides an array of valve features that can be simulated. Computer transient modeling software allows users to model a single-phase flow.
Consider the possibility of two-phase flow in the application that can be identified through transient pressure monitoring. Is the pumping and piping system experiencing cavitation? If so, is it from the pump suction or pump discharge pressure during a pump trip? Valve operation creates a change in velocity in a piping system.
When a valve is operated, the upstream pressure will increase and downstream pressure will decrease and, in some cases, create cavitation. A simple solution to pressure surges could be slowing down the operating time when closing a valve.
Change in Frequency
Is the user trying to maintain a constant flow rate or pressure? The communication time between drives and pressure transmitters could cause a system to hunt. For every action, there is a reaction, so try to understand the pressure transient via wave speed. When a pump is ramped up, there will be an upsurge in pressure, but the high-pressure wave will reflect back as a negative pressure wave. Tune the motor control drives and control valves with high-frequency pressure monitoring.
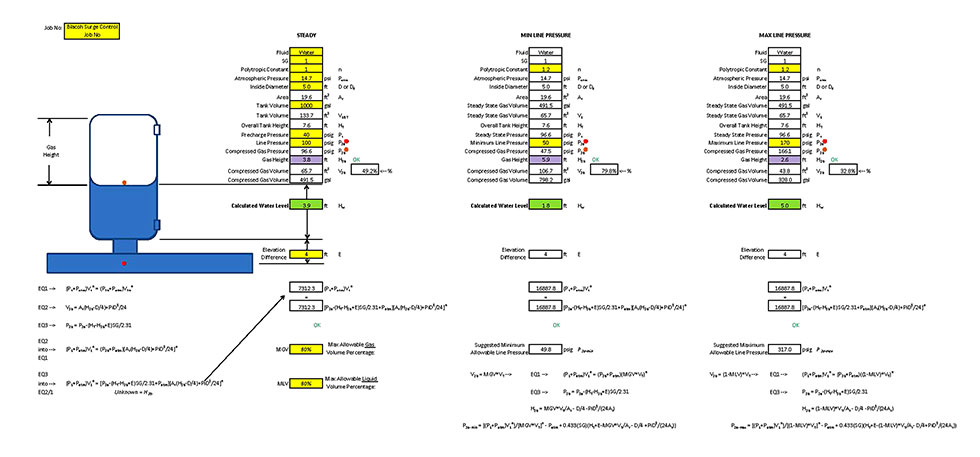
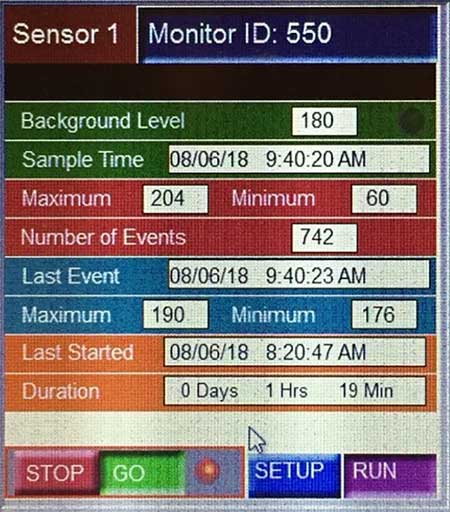
Image 3 shows unstable pressure created by the variable frequency drives (VFDs). The discharge pressure fluctuated between 204 psi and 60 psi with s742 pressure surge events in one hour and 19 minutes.
Control valve oscillations: surge pressure waves travel through control valves before they can react to the shock wave. Flow control, backpressure control and pressure reducing valves have reaction time. To give and receive energy, installing a pulsation and surge vessel will cushion the shock wave. In sizing a pulsation dampener and surge vessel, it is critical to understand steady state and minimum and maximum pressure waves. Gas charge and gas volume must be ample to address the energy change.
Gas and liquid level calculations are used to confirm pulsation dampeners and surge vessels with a polytropic constant of 1 in steady state and 1.2 during transient pressure events. Active valves (open/close) and check valves (closing) are standard changes in velocities that bring focus. A surge vessel installed downstream of the check valve will give energy to the charge in velocity when the pump is de-energized.
If a pump is running off the curve, creating backpressure is necessary. If a user is experiencing pressure fluctuations from the backpressure control valve, the system may need a pulsation dampener upstream. Make sure the surge vessel gas volume is sized to accept enough energy if the valve closes too quickly.
Check valves should be sized per the pump flow, pressure and length of pipe for the correct closing time. There have been several pumping installations where the check valve was oversized, partially open and oscillating in the flow stream, which created excessive vibrations.
Finding the Needle in the Haystack
Deciphering over-pressure events in large networks of process piping requires multiple monitoring points. This will help determine where the pressure wave is coming from. Negative pressure waves created when dropping below the vapor pressure can be challenging. Two-phase flows with gas pressures accelerating and collapsing can be recorded via transient pressure monitoring. Using forensic engineering to discover the root cause of pressure surges starts with transient pressure monitoring.
