

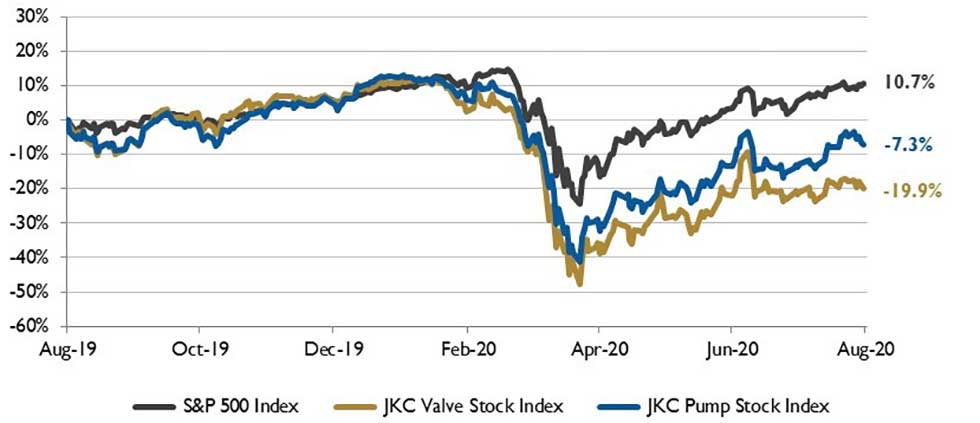
The Jordan Knauff & Company (JKC) Valve Stock Index was down 19.9 percent over the last 12 months, while the broader S&P 500 Index was up 10.7 percent. The JKC Pump Stock Index fell 7.3 percent for the same time period.1
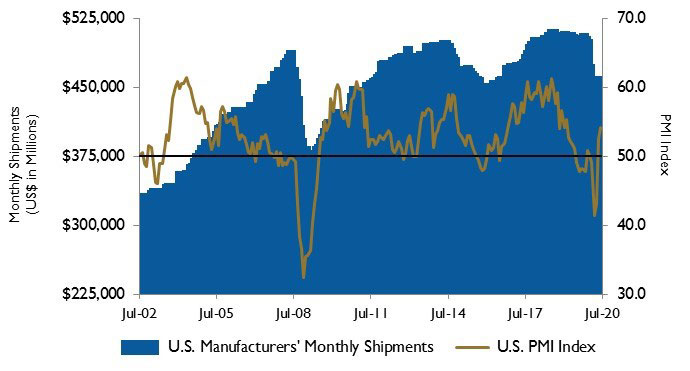
The Institute for Supply Management’s Purchasing Managers’ Index (PMI) jumped to 54.2 percent in July, marking the highest reading in more than a year. The production index rose nearly five points to 62.1 percent and should stay strong at least in the immediate future with the new orders index making a similar gain rising to 61.5 percent. The supplier delivery index slipped 1.1 point to 55.8 percent. The lower reading signals that bottlenecks in the supply chain are easing up after the index reached nearly a 50-year high of 76.0 percent back in April.
Total industrial production for the United States rose 5.4 percent in June, as low oil prices weighed on energy extraction. As more of the nation’s factories reopened in June, manufacturing production grew 7.2 percent. Auto and parts production posted a significant gain (up 105 percent), as consumers began to return to car dealers. The rebound extended more broadly beyond the auto sector compared to May, with production in every major manufacturing industry up in June. However, manufacturing output is down 11 percent since January.
The Department of Commerce reported that consumer spending rose 5.6 percent in June after jumping an upwardly revised 8.5 percent in May.
Consumer spending accounts for nearly two-thirds of the U.S. gross domestic product.
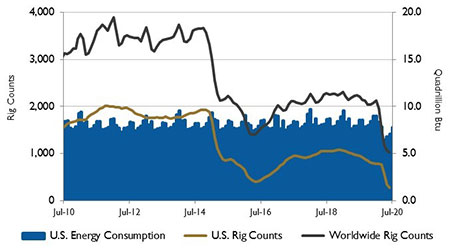
Production of crude oil decreased in the U.S. in May by 1.99 million barrels per day (b/d), the largest monthly decrease since at least January 1980. This decrease surpassed the previous record drop in September 2008 when hurricanes caused production to fall by 1.03 million b/d. May marks the sixth consecutive monthly decrease in crude oil production.
The U.S. Energy Information Administration (EIA) expects U.S. crude oil production to rise in July as demand and prices increase. After averaging 12.8 million b/d in the first two months of 2020, the EIA forecasts that U.S. crude oil production will average 11.6 million b/d in 2020. The benchmark West Texas Intermediate (WTI) crude oil average spot price dropped from $58 dollars per barrel (b) in January to $17/b in April; however, WTI increased to $29/b in May as production decreased and
demand increased.
On Wall Street, the markets rallied for the fourth consecutive month in July. The Dow Jones Industrial Average, the S&P 500 Index and the NASDAQ Composite gained 2.3 percent, 5.5 percent and 6.8 percent, respectively.
The rally took place despite the resurgence of coronavirus in as many as 24 states, which forced them to close some parts of the economy that were reopened just a month ago.
