

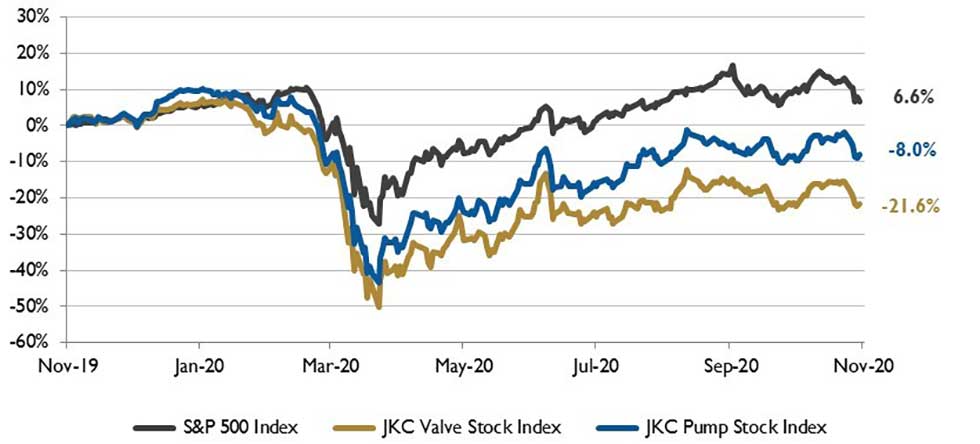
The Jordan Knauff & Company (JKC) Valve Stock Index was down 21.6 percent over the last 12 months. The S&P 500 Index was up 6.6 percent. The JKC Pump Stock Index fell 8.0 percent for the same period.1
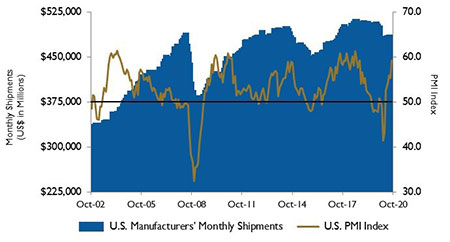
The Institute for Supply Management’s Purchasing Managers’ Index (PMI) registered 59.3 percent in October, up 3.9 percentage points from the September reading, the highest since September 2018. The New Orders Index registered 67.9 percent, an increase of 7.7 percentage points from the September reading, the highest level since 2004. The Production Index registered 63 percent, an increase of 2 percentage points compared to September’s reading of 61 percent. The Employment Index registered 53.2 percent, an increase of 3.6 percentage points from the September reading, in expansion territory for the first time since mid-2019. Inventories have been drawn down across wholesalers and retailers, with respondents characterizing customer inventories as too low by the widest margin in more than a decade.
The JPMorgan Global Manufacturing PMI rose from 52.4 percent in September to 53 percent in October, its highest level since May 2018. Expansion was seen across the world’s major markets, led by the Eurozone. Of the PMI’s five components, output rose in October at the fastest rate since February 2018, driven by the sharpest increase in new orders since January 2018. Growth was especially strong in Germany, reflecting a record inflow of new orders. Output growth also accelerated in the U.S., to the fastest for almost a year. While companies are optimistic that an end to the pandemic could come within a year, they seem to be taking precautions to avoid expanding capacity.
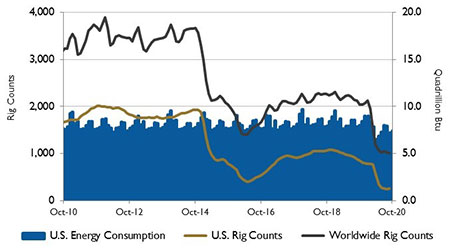
Month-over-month global consumption of crude oil rose by 1 million barrels per day (b/d) during August and September, compared with an increase of 4.1 million b/d from May through July. The U.S. Energy Information Administration (EIA) estimates that global oil markets have shifted from global liquid fuels inventories building at a rate of 7.3 million b/d in the second quarter to drawing down at a rate of 3.1 million b/d in the third quarter.
Global consumption of liquid fuels and petroleum averaged 95.3 million b/d in September. Liquid fuels consumption was down 6.4 million b/d from September 2019, but it was up from an average of 85.1 million b/d during the second quarter and 93.9 million b/d in August. EIA forecasts that global consumption of petroleum and liquid fuels will average 92.8 million b/d for 2020, down by 8.6 million b/d from 2019.
On Wall Street, the Dow Jones Industrial Average, the S&P 500 Index and the NASDAQ Composite dropped 4.6 percent, 2.8 percent and 2.3 percent, respectively, in October. Rising coronavirus cases, the presidential election and the stalled fiscal stimulus package contributed to the volatility.
