

The U.S. annual rate of inflation has risen since early 2021 when the economy rebounded from the pandemic leading to supply disruptions and other factors that put upward pressure on prices. The Russian invasion of Ukraine in March, the ease in COVID lockdowns in Shanghai and Beijing, the announcement by the European Union that it will reduce crude oil imports from Russia by 90% by the end of the year, and the increase in travel, created a perfect storm of conditions leading to higher prices.
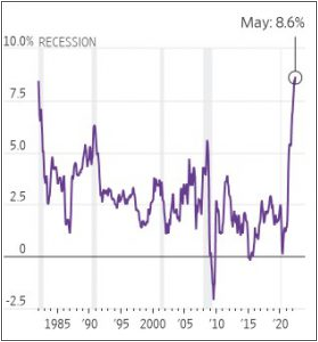
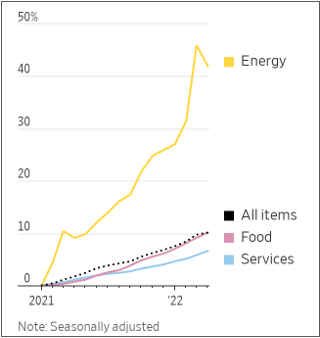
Energy disruptions caused by the Ukraine war and the lack of workers to fill vacancies in the U.S. are exacerbating strains on the economy’s ability to meet demand without affecting prices. The Labor Department reported that the Consumer Price Index (CPI) increased 8.6% in May from the same month a year ago, the fastest increase in inflation since December 1981. May’s inflation was driven in part by sharp rises in the prices for energy, which rose 34.6% from a year earlier, and groceries, which jumped 11.9%, the biggest increase since 1979.(1)
Prices for energy, which impact virtually every sector of the economy, were further broken down in the May CPI as follows: gasoline increased 48.7%; fuel oil rose 106.7%, representing the largest increase in the history of the series which dates back to 1935; and natural gas increased 30.2%, the largest increase since July 2008.(1)
While the war in Ukraine and supply chain impacts from Russian sanctions have increased price pressures, energy prices were already escalating well before the conflict. In the year preceding Russia’s invasion of Ukraine, gasoline prices had increased by about 40%.(3)
Historically, oil prices have had more influence on the Producer Price Index (PPI), which measures the prices of goods at the wholesale level, than the CPI, which measures the prices consumers pay for goods and services. On an annualized basis, the PPI rose 10.8% in May from a year ago, down slightly from 10.9% in April.(1) May marked the sixth consecutive month of double-digit annual gains for producer prices. Continued pressure on producer prices may signal future rises in CPI as costs pass through supply chains.(4)
Approximately 71% of the 7.2 billion barrels of petroleum the U.S. consumed in 2021 was used for various types of fuels, such as gas, diesel, and jet fuel. This demand pushes up transportation costs and makes shipping everything from refrigerator components to everyday items more expensive. Most of the other 29% of the oil Americans use is contained in much of the things people buy, both in the packaging and in the products themselves.(5) Petrochemicals derived from petroleum are used to manufacture clothes, computers and more. For example, the quantity of oil-based polyester in clothing has doubled since 2000. Over half of all fibers produced around the world are now made from petroleum, which equates to over 1% of all oil consumed.(6)
Crude oil prices increased as COVID restrictions began to ease and the war in Ukraine continued. According to Eurostat, Russia is the main supplier of crude oil, natural gas and solid fossil fuels to the European Union, and the invasion of Ukraine presented an urgent need in Europe to replace natural gas from Russia.
These factors contributed additional upward pressure on prices that were already high because of low inventory levels globally. The price of West Texas Intermediate crude oil rose from around $40 a barrel in 2020 to more than $120 a barrel in early June,(5) and the average price of a gallon of regular unleaded gasoline in the U.S. hit a record high of $5 on June 10th.(2)
Natural gas prices in the United States rose substantially over the past year and a half, after many years of relatively low prices that led to a steady rise in the use of natural gas for electricity generation. Just before the pandemic, prices fell below $2.00 per million British thermal units (MMBTu) as domestic production reached new highs. The fuel got even cheaper as economic activity fell, hitting its lowest price since the mid 1990s during the pandemic.
Natural gas prices are rising now due to three factors: inventories below the five-year average; steady demand for U.S. liquefied natural gas (LNG) exports; and high demand for natural gas from the electric power sector. The U.S. Energy Information Administration (EIA) expects natural gas prices to average $8.69 MMBtu in the third quarter of this year. U.S. natural gas inventories ended May at 2.0 trillion cubic feet, 15% below the five-year average. Europe has become the main destination for U.S. LNG exports accounting for 74% of total U.S. LNG exports during the first four months of this year.(5)
Even before COVID, energy producers cut back on investment and less profitable projects under pressure from low prices and institutional shareholders demanding higher returns. Producers slashed output further during the height of the pandemic, when the need for petroleum products fell significantly. Demand has rebounded as business and leisure travel resumed and manufacturing returned, however, energy supply remains constrained by previously mentioned factors.
Oil companies are reluctant to increase production after pledging capital discipline to shareholders and investors. Like other commodities, energy prices are dictated by basic supply and demand. Energy companies are still recovering from pandemic-related lockdowns and are struggling to source the materials and workers necessary to expand production. Global shortages and transportation bottlenecks have pushed inputs like tubular steel and fracking sand to historically high prices with other inputs being unavailable altogether. These restrictions are limiting new exploration globally and preventing supply from keeping up with demand.(3)
In addition, the rapid rise in American fuel exports has pushed gasoline prices up and is pressuring the U.S. price of natural gas. Seaborne shipments of gasoline, diesel and jet fuel departing the U.S. in March, April, and May of this year averaged 32% more compared with the same period last year, and 11% higher than the same period in 2019.(7)
Exports of natural gas reached a record in March, up to approximately 22% of U.S. gas production, according to the EIA. In March, President Biden agreed to more than double the volume of LNG the U.S. exports to Europe in the coming years. Last year Europe imported a record amount from the U.S., and in December the U.S. overtook Qatar and Australia to become the world’s largest exporter of LNG. The EIA predicts LNG exports will be 16% more than last year.(8)
Constrained refining capacity is beginning to play a role in the supply of petroleum products as well. Since the beginning of the pandemic, at least 13 U.S. refineries shut down, significantly cut operations or switched to refining other products. The loss accounts for more than 1.4 million barrels of oil per day, or more than 7% of the country’s entire capacity of gasoline, diesel and jet fuel. Worldwide refining production has declined by an additional 2.1 million barrels per day.(9)
According to the International Energy Agency (IEA), global demand for oil will rise above pre-pandemic levels next year. However, oil producers are expected to struggle to keep up with the rapid pace of rebounding oil demand. OPEC+ oil producers (an alliance of OPEC and non-OPEC producers led by Russia) have struggled to meet their targets for modest supply hikes due to technical issues and capacity constraints. The IEA expects OPEC+’s issues to continue into 2023.
Addressing these issues will not instantly increase oil and gas supplies. Energy production requires lead time. The breadth and persistence of these issues implies that for energy inflation to ease, demand must decline.
May’s resurgence in price increases puts pressure on the Federal Reserve Bank to raise interest rates aggressively to attempt to tame inflation. Raising interest rates will make it more expensive for oil companies to borrow money to fund increased production, which could hold back any additional flow of oil and gas.
Sources:
- U.S. Bureau of Labor Statistics.
- The Wall Street Journal, U.S. Inflation Hit 8.6% in May, June 10, 2022.
- U.S. Chamber of Commerce, Combating Inflation: What’s Behind High Energy Prices and What to Do About It, May 5, 2022.
- The Wall Street Journal, U.S. Supplier Price Gains Accelerated in May, June 14, 2022.
- U.S. Energy Information Administration.
- The Conversation, Soaring Crude Prices Make the Cost of Pretty Much Everything Else Go Up Too Because We Almost Literally Eat Oil, March 28, 2022.
- The Wall Street Journal, High U.S. Fuel Exports Are Contributing to $5-a-Gallon Gas, June 16, 2022.
- The Wall Street Journal, The LNG Export Boom Is Draining U.S. Natural-Gas Supplies and Lifting Prices, March 30, 2022.
- Transport Topics, Diesel’s High Cost Due to Refining Capacity Shortage, Exports, Experts Say, May 19, 2022.
