
An effective program can increase the reliability and availability of machinery while minimizing maintenance costs.
12/03/2015
Read the first part of this article here.
An oil’s viscosity is considered its most important property. The most common technique for measuring viscosity is following ASTM D445 using a viscometer. A small sample of the oil is drawn into a calibrated capillary tube in a constant temperature bath. Once the sample comes to temperature, it flows a predetermined distance down the tube. The viscosity is the product of the flow time and tube calibration factor. The results are reported as the oil’s kinematic viscosity in centistokes (cSt).
Industrial oils are identified by their International Organization for Standardization viscosity grade (ISO VG). The ISO VG refers to the oil’s kinematic viscosity at 40 C (104 F). An oil’s weight commonly refers to its kinematic viscosity at 100 C (212 F). The weight of multi-grade oils is represented by the second number in the rating. A 10W30 would be 30-weight oil. The 10 before the W, which stands for winter, refers to how the oil performs in cold weather.
When an oil’s viscosity increases, it is usually due to oxidation, degradation or contamination. This is the result of extended oil drain intervals, high operating temperatures or the presence of water or another oxidation catalyst. Increased viscosity can also be the result of excessive contamination with solids, as well as topping off with a higher grade lube.
A decrease in the oil’s viscosity is most commonly due to contamination with fuel or a solvent. An oil’s viscosity also can be affected if the wrong oil is used for top off or replenishment.
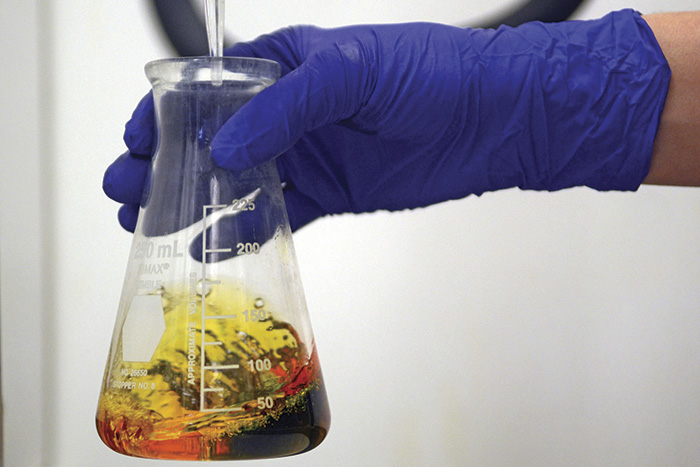 Image 1. Acid number is measured by titration using ASTM ASTM D974. This test technique involves diluting the oil sample and adding incremental amounts of an alkaline solution until a neutral endpoint is achieved. (Images courtesy of TestOil)
Acid Number
Acid number (AN) is an indicator of oil health. It is useful in monitoring acid buildup in oils due to depletion of antioxidants. Oil oxidation causes acidic byproducts to form. High acid levels can indicate excessive oil oxidation or depletion of the oil additives, and they can lead to corrosion of the internal components. By monitoring the acid level, the oil can be changed before any damage occurs. An oil analyst is looking for a sudden increase. When oil is flagged for high acid levels, it indicates accelerated oil oxidation, and the oil should be changed as soon as possible. If any of the remaining highly acidic oil is left, it will quickly deplete the antioxidants in the new oil. Acid number is measured by titration using ASTM D974. This method involves diluting the oil sample and adding incremental amounts of an alkaline solution until a neutral endpoint is reached. The AN of a new oil will vary depending on the base oil additive package. A rust and oxidation oil will usually have a very low AN, around 0.03. An anti-wear or extreme pressure oil will have a slightly higher value, typically around 0.5. Engine oils commonly have a higher AN, around 1.5.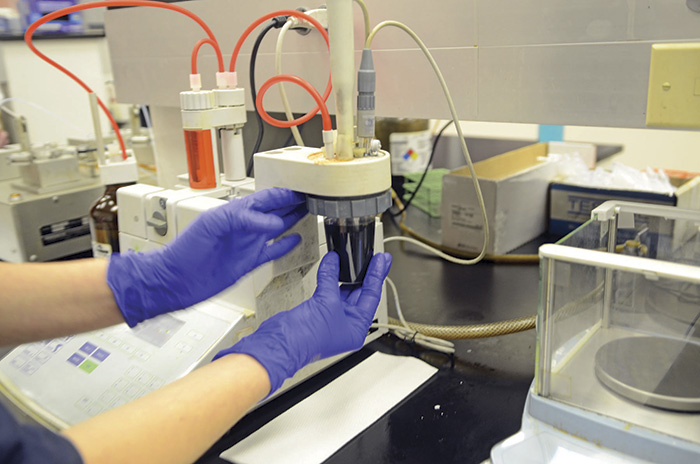 Image 2. Base number testing measures the reserve alkalinity in a lubricant. The amount of reserve alkalinity in a lubricant is critical for certain oils.
 Base Number
Base number testing is similar to AN testing except the properties are reversed. The oil sample is titrated with an acidic solution to measure the oil’s alkaline reserve. ASTM D4739 is the most commonly used method. Many oils, especially motor oils, are fortified with alkaline additives to neutralize acids that are formed as a result of combustion. In diesel engine applications, acid is formed in the combustion chamber when moisture combines with sulfur under pressure. Measuring the base number will help ensure that a sufficient amount of additives have been added to the oil to help resist oxidation due to acid. The base number of oil is highest when the oil is new and decreases with use. Condemning limits are based on the application. The base number should not drop below half of its original value. Base number values for new engine oils vary greatly based on the application.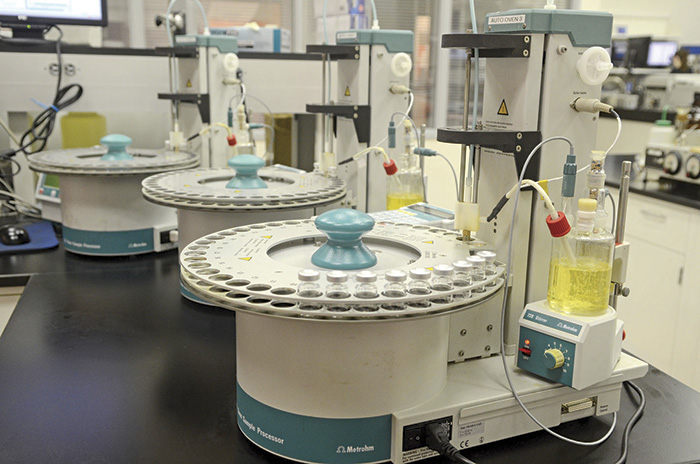 Image 3. Using the Karl Fischer titration method, a reagent is titrated into a measured amount of sample and reacts with the hydroxide molecules present in the moisture. This depolarizes an electrode and determines the titration endpoint. Results are reported as either percent water or ppm (1 percent = 10,000 ppm).
Water Contamination
Water contamination is detrimental to any lubricant. A simple crackle test is used to determine if water is present in oil. A small volume of the lubricant is dropped onto a hot plate and, if bubbles or crackles occur, water is present. If a crackle test is positive, further testing is needed to quantify the amount of water by using Karl Fischer titration by ASTM D6304. A measured amount of oil is introduced into a titration chamber. This solution is titrated with Karl Fischer reagent to a specific endpoint. The amount of reagent used and the sample volume are calculated and converted to parts per million (ppm) or percent by mass. Low levels of water (0.5 percent) are typically the result of condensation. Higher levels can indicate water ingress. Water can enter a system through seals, breathers, hatches and fill caps. Internal leaks from heat exchangers and water jackets are other potential sources. When free water (non-emulsified) is present in oil, it poses a serious threat to the equipment. Water is a very poor lubricant and promotes rust and corrosion to the components. Dissolved water in oil (emulsified) will promote oil oxidation and reduce the oil’s load-handling ability. Water in any form will cause accelerated wear, increased friction and high operating temperatures. If left unchecked, water will lead to premature machine failure. In most systems, water should not exceed 500 ppm.Particle Count
Particle count testing is a way to monitor the level of solid contamination in oil. Two types of automatic particle counters are used to test oil cleanliness: light blockage and pore blockage. The light blockage technique involves passing a sample through a small orifice that has a laser light source on one side and an optical sensor on the other side. Particles interrupting the light beam are counted, and size is determined by the degree of light blockage. Light blockage particle counting is not effective when oil is contaminated with water or when air is entrained in the oil. Water or air bubbles can be counted as particles, causing erroneous results. The pore blockage or flow decay technique passes the sample through a mesh filter. As a filter clogs, the sample’s flow is slowed. The amount of flow decay is calculated, and the particle count can then be extrapolated. Because water droplets and entrained air will not restrict the fluid flow, there is no interference from these contaminants. Results are reported as particles per milliliter in six size ranges: >4, >6, >14, >25, >50 and >100. ISO Cleanliness Codes are then assigned for particles in 4, 6 and 14 micrometer (μm) ranges (ISO 4406:1999). The result is reported by three numbers with a slash between them; the first number refers to particles in the >4 μm range, the second to particles in the >6 μm range and the third in the >14 μm range. The lower the numbers in the ISO Cleanliness Code, ISO 4406, the cleaner the fluid. Particulate contamination is a measurement of the effectiveness of filtration and can indicate excessive external contamination. Advanced machine wear also causes increased particle counts. Generally, the lower size ranges indicate contamination and silt, while the larger size ranges point to wear problems.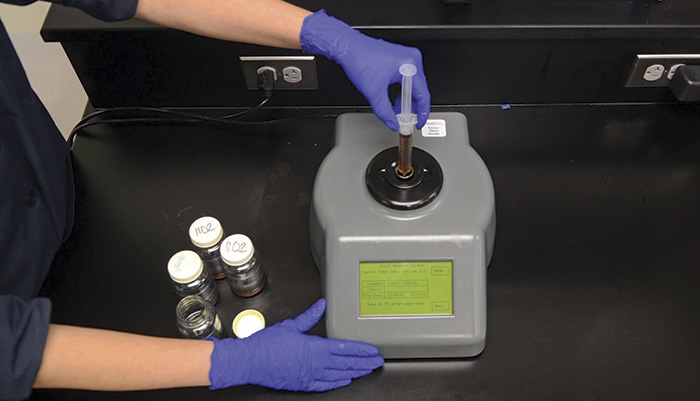 Image 4. The ferrous wear concentration gives a direct measure of the amount of ferrous wear metals present in a sample.