
Positive displacement (PD) pump technologies vary, as do the curves for these pumps. A person without significant exposure to pump selection is often experienced only with centrifugal pump curves. Therefore, it can be frustrating to get the data required from a positive displacement curve. Though curves vary with differing technologies, the same process can be successfully applied. In this article, we will walk step by step through a circumferential piston pump curve to identify the speed and horsepower (hp) needed to operate this pump and achieve a desired flow and pressure with a given fluid. First, identify the plot on the performance curve that has vertical and horizontal axis displaying the speed (measured in rotations per minute [rpm]) and flow (measured in gallons per minute [gpm]) of the pump. On the sample curve shown in Image 1, speed is along the X-axis at the bottom and flow is along the Y-axis. The blue lines on this plot represent performance adjustments based on slip at a given pressure, in this case a range from 0 to 120 pounds per square inch (psi). Note that if the liquid is more viscous than water, the slip will be less than represented because there is more resistance in the clearances of the pump. For this example, the application requires 150 gallons per minute (gpm) at 30 psi of water or a product with water-like viscosity.
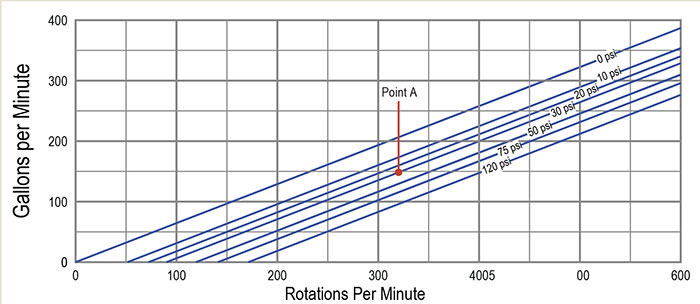 Image 1. Speed in rpm vs. flow in gpm. All performance curves based on tests using 70 F water and 0 psig inlet pressure. A tolerance of plus or minus 5 percent applies to all figures. Actual performance may vary by application product. Please contact the manufacturer for different conditions. (Images courtesy of Crane Engineering)
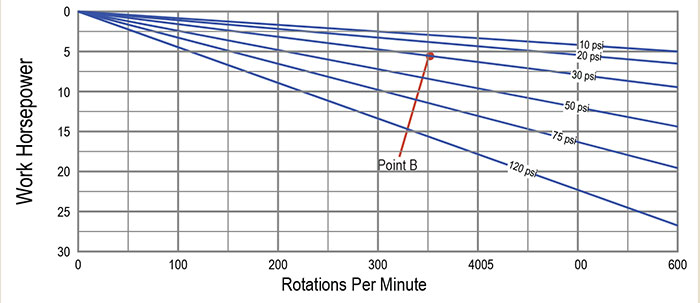 Image 2. Work horsepower plot
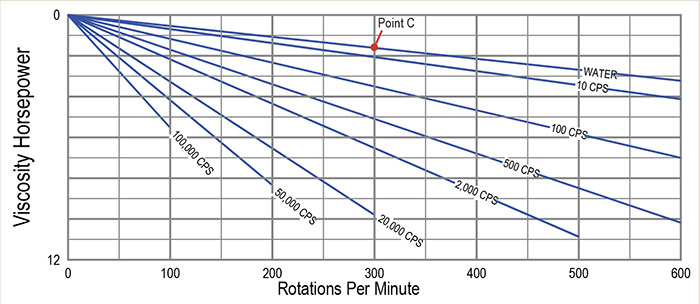 Image 3. Viscosity horsepower plot
 With only a 5 percent safety factor, this indicates a 7.5-hp motor should be selected. A 15 percent safety factor on the selection calculated would be 8 hp, so a 10-hp motor would be provided.
With the selection complete, the user can size the motor correctly and make a selection that will vary the speed from motor speed—whether it be a gear reducer, belts and sheaves, or a variable speed drive (VSD). If a VSD is used, be sure the motor will have enough torque available at all operating points with the torque capability of your selected motor in mind.
If pumping a liquid with a higher viscosity than water, a correction should be applied to the blue pressure lines on the top plot. Since viscosity is resistance to flow, this also reduces the slip from the discharge of the pump back to the suction side through the clearance. As viscosity increases, the blue lines will draw in closer to the 0 psi line, making the pump more efficient per revolution at a given pressure. Some curves provide a correction.
If this is not available on the curve, contact the manufacturer.
It is important to understand which pieces of information are needed before looking at the curve. Apply these simple steps to find the data on almost any positive displacement curve.
With only a 5 percent safety factor, this indicates a 7.5-hp motor should be selected. A 15 percent safety factor on the selection calculated would be 8 hp, so a 10-hp motor would be provided.
With the selection complete, the user can size the motor correctly and make a selection that will vary the speed from motor speed—whether it be a gear reducer, belts and sheaves, or a variable speed drive (VSD). If a VSD is used, be sure the motor will have enough torque available at all operating points with the torque capability of your selected motor in mind.
If pumping a liquid with a higher viscosity than water, a correction should be applied to the blue pressure lines on the top plot. Since viscosity is resistance to flow, this also reduces the slip from the discharge of the pump back to the suction side through the clearance. As viscosity increases, the blue lines will draw in closer to the 0 psi line, making the pump more efficient per revolution at a given pressure. Some curves provide a correction.
If this is not available on the curve, contact the manufacturer.
It is important to understand which pieces of information are needed before looking at the curve. Apply these simple steps to find the data on almost any positive displacement curve.