

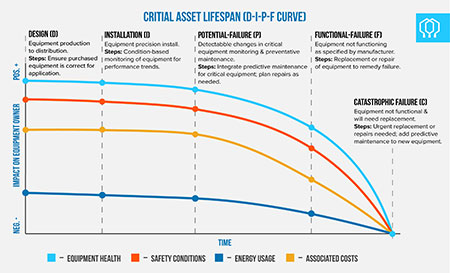
 IMAGE 1: Example of a D-I-P-F curve (Images courtesy of Jenkins Electric)
In 1978, the Reliability-Centered Maintenance report by F. Stanley Nowlan and Howard F. Heap introduced maintenance technicians to the first iteration of the potential-failure/functional-failure (P-F) curve.
The report was sponsored by the United States Department of Defense to be a roadmap for managing reliability on many different types of equipment. The initial design stood as a guide to the current versions of the curve that continue to develop and evolve in a growing desire to keep equipment running longer and cost of operation to a minimum.
The desire to keep critical equipment running has driven us to evolve the curve to encompass newer technologies with already existing best practices. Today, the most commonly accepted version is called the D-I-P-F curve as introduced by Doug Plucknette in 2006.
Design – “D”
What was once left off the original versions of the curve might well be one of the most critical aspects of equipment health. Is the motor that was selected the right one for the application? Is the structure the motor attaches to properly secured for the forces that will be applied? Does the pump have enough head pressure to lift the fluid up and through the rest of the system?
All these questions make up the design aspect of the curve. If the equipment is not properly designed, the reliability will be poor, and the battle to keep equipment running will frustrate maintenance technicians and management alike. The design phase of reliability will make or break the success of a reliability program and should not be ignored. Getting the correct specifications of equipment is critical to equipment longevity.
Installation – “I”
Any system can be foiled by improper installation. Transportation of the equipment can affect reliability and operational life of the equipment. Installation lets the roots of designed reliability take hold. A house built on sand will fall many years before the house built on solid ground. It is imperative that proper installation techniques be applied to ensure a healthy, reliable system.
Installation standards ensure that the designed reliability in the system is achieved from the start. Alignment procedures must be followed, including soft foot checks and thermal growth calculations. Pipe strain in pumping systems must also be eliminated.
Acceptance testing must be performed, and quality of work verified by a reliability team member or maintenance technicians competent in the system. This is when users set themselves up for the high road of success, or the ditch of failure.
Potential Failure – “P”
Regardless of how well a system is designed or how perfect the installation was, failure will occur. “P” is not where equipment failure occurs but rather where failure can be detected. The time between “I” and “P” is where predictive maintenance should be introduced. It is during this time that data can be trended to discover the potential failure point.
%5B3%5D%5B8%5D-980x400.jpg) IMAGE 2: Condition-based monitoring can keep technicians safe.
IMAGE 2: Condition-based monitoring can keep technicians safe.Several options such as periodic vibration analysis, temperature monitoring, oil analysis and ultrasound data analysis can help detect and often extend the time until potential failure becomes present. Once equipment enters the potential failure zone, the maintenance technician must move into corrective action and increase the frequency of monitoring.
Corrective measures could be simply using ultrasound data analysis to restore lubrication to the appropriate levels in the bearings, or it could be replacing a coupling spider that has worn out and verifying alignment.
Repairing a crack in a mounting frame that was detected in the latest vibration route will keep users up and running. This time period of increased monitoring frequency will also allow users to trend the rate of failure and plan for repairs. A planned repair caught in the early stages of failure will almost always be less expensive than waiting for the functional failure of the equipment.
Functional Failure – “F”
Once the equipment enters in the functional failure (F) point of the curve, it is no longer producing the results it was designed for. This could be a pump that loses flow and head pressure or a motor that will trip out on over current.
Operational, monitoring and repair costs all increase when equipment loses core functionality. Repair costs increase in unplanned downtime, and the time frame to return to service is shortened. Rush fees are assessed by the repair facility to get users back up and running, increasing the repair cost 30 to 50 percent.
Potential for safety issues, like technician injury, also increase as the equipment progresses toward instability.
With more monitoring, the maintenance technician is put in close proximity to the equipment more frequently, increasing injury potential. Users want to avoid this reactive phase and pull equipment when entering the potential failure (P) zone rather than the functional failure (F) zone to protect maintenance technicians and keep repair costs to a minimum.
Catastrophic Failure – “C”
This has happened to everyone. It can happen even with best maintenance practices in place due to an anomaly. Using condition-based monitoring will reduce the possibility of this happening substantially. Once equipment reaches this point, repair costs are at their highest and lead times on repair are at their longest.
Often, this point is when a decision must be made whether to repair or replace.
Depending on the type of equipment, availability of a replacement could be a factor, in addition to high repair cost in order to get production running again in a reasonable time frame. Catastrophic failure is also the most dangerous type for technicians working around the equipment.
Keep technicians safe, costs down and repair time to a minimum by using condition-based monitoring and predictive maintenance to avoid this point on the curve. For critical assets, keep spares or items with long lead times on the shelf or use equipment storage through the repair provider to ensure equipment is tested and ready for installation. This will also secure productivity and keep operational costs to a minimum.
Conclusion
The D-I-P-F curve is a useful tool for building a solid condition-based reliability program, such as a predictive maintenance program. While the curve design has changed, the end goal has not: save money, keep running.
A planned repair will always be cheaper than an unplanned repair. By using best practices in each part of the curve and cultivating a preferred vendor list prior to failures, users will be set up with healthy equipment and a plan for when things go wrong.
