
Pumping Prescriptions
Pumping Machinery LLC
10/18/2016
The objective of this month’s column is to show end users how to hydraulically evaluate their pump systems and determine the power required for the drivers to move the desired flow through the piping/process. A process designer usually begins a project by determining how much flow must be pumped from point A to point B. The details of the piping, required pumps, coolers, filters and instrumentation are determined based on the flow.
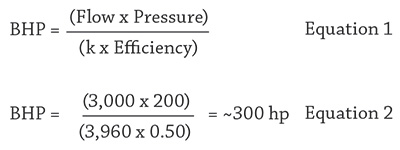
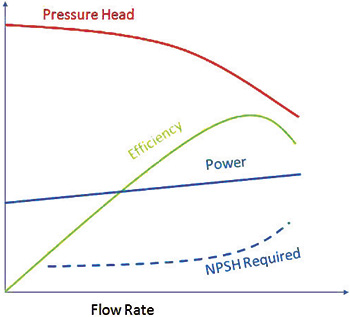 Figure 1. Typical pump performance curve (Graphics courtesy of the author)
_0.jpg) Figure 2. An example of a Knapp diagram: The red line shows the head-flow (left) relationship at 100 percent rpm and the torque-flow (right) relationship for a 1,800-Ns pump.
Figure 2. An example of a Knapp diagram: The red line shows the head-flow (left) relationship at 100 percent rpm and the torque-flow (right) relationship for a 1,800-Ns pump.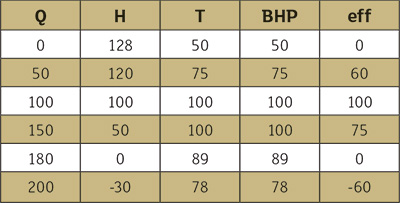 Table 1. The curve from Figure 2 digitized at 100 percent rpm (100 percent efficiency is simply a reflection of the BEP conditions of 100 percent flow, head and power)
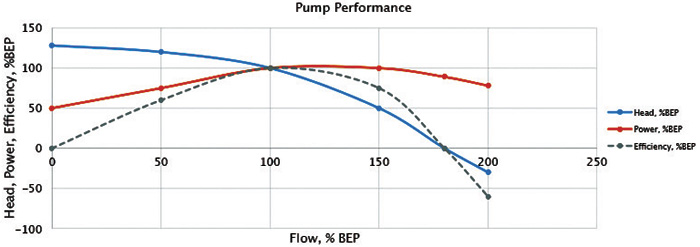 Figure 3. Pump performance curve into the extended flow range
To read more Pumping Prescriptions columns, click here.
