
The mergers and acquisitions (M&A) activity in terms of number of deals on a global basis remained strong year over year versus 2021. The macro deal activity in Europe was slightly stronger year over year compared to North America. Valuations also declined by nearly 20% year over year versus 2021 and is the lowest it has been in the last five years. This drop is driven by strategic buyers in the upper-level middle market and above, while valuations in lower middle markets have remained strong.
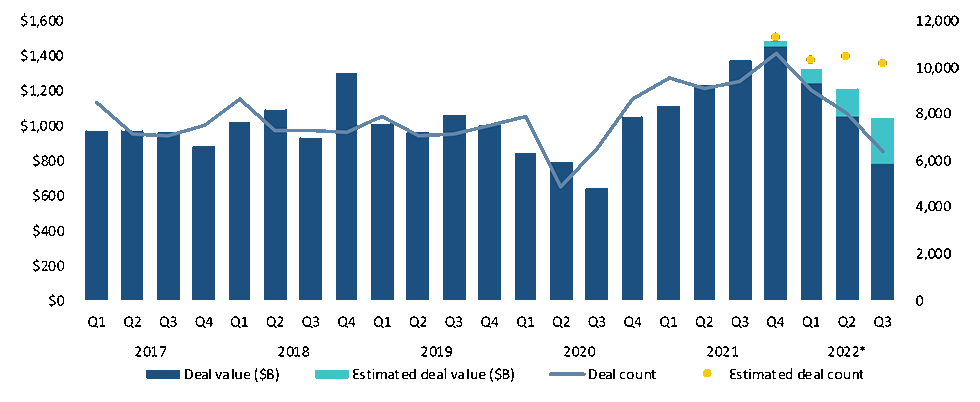
Images 1, 2 and 3 indicate the number of completed transactions and transaction activity by total deal value in a given period. It also indicates the estimated completed transactions after the actual data for those periods becomes available, and the same for total deal value.
The number of transactions is a better barometer of M&A activity since the total value of transactions is
impacted by multiple factors related to the mix of activity such as industries, deal size and difference in valuations between the periods.
Global M&A Activity by Quarter
As shown in Image 1, the level of global deal activity was consistent in the years prior to the pandemic. During this time (2017 through 2019), we had a favorable M&A environment with low-cost and readily available debt capital, strategic buyers with strong balance sheets, financial buyers with high levels of dry powder and positive growth outlooks.
Starting in Q2 2020, the M&A activity took a pause while the world struggled with pandemic driven lockdowns and economic uncertainty. Deal activity bounced back quickly to record levels starting in Q3 2020. The activity peaked in Q4 2021 but remained surprisingly strong through 2022 given the increasing cost of capital, more uncertainty in economic growth rates going forward and geopolitical concerns in Europe and Asia.
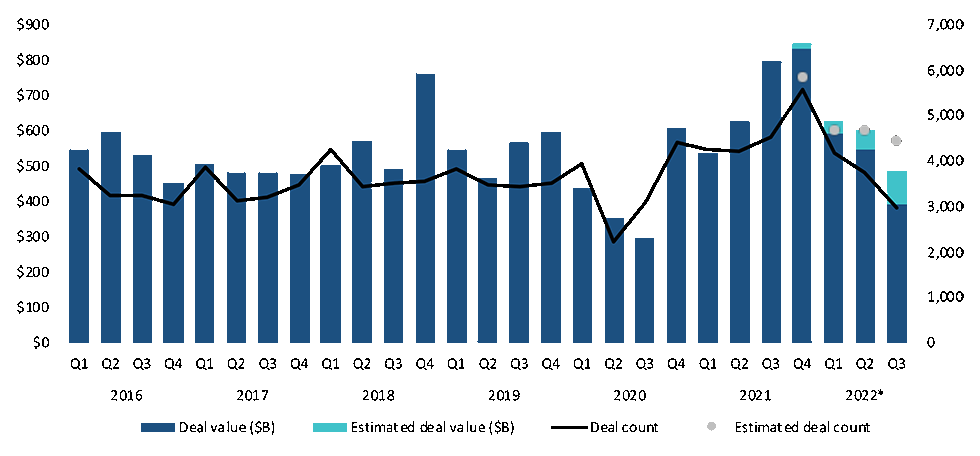
North American M&A Activity by Quarter
As seen in Image 2, the North American deal activity (in terms of deal count) was consistent from 2016 through Q1 2020 before declining 43% in Q2 2020. The activity level recovered quickly, getting back to pre-pandemic levels by Q4 2020 and then continuing over the next four quarters to the peak in Q4 2021, which was 163% above the low point of Q2 2020. While the activity level cooled off in 2022, it remained at levels above historical levels.
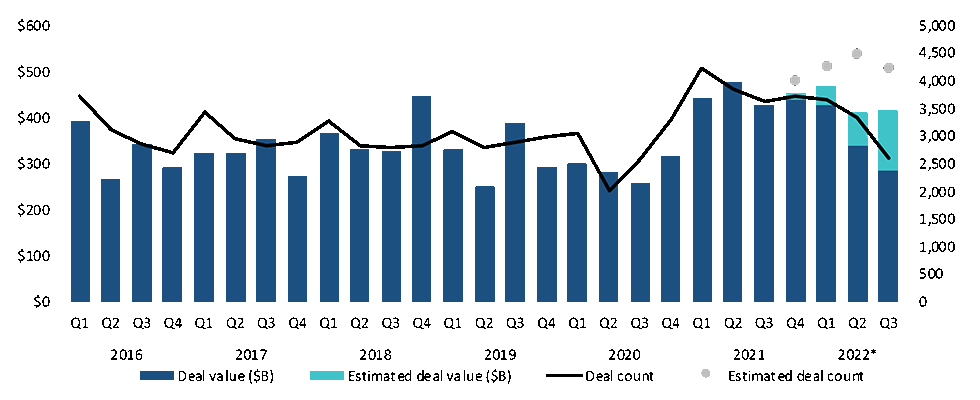
European M&A Activity by Quarter
The European deal activity, in terms of deal count, was also consistent from 2016 through Q1 2020 before declining 34% in Q2 2020 (Image 3). The activity level in Europe also rebounded quickly over the next three quarters, surpassing pre-pandemic activity by Q1 2021 and maintaining that high level into 2022.
Valuations Take a Step Back or Hold Their Own
The valuation of any business is specific to a specific seller and a specific buyer, but there are fundamental factors that have significant impact on valuations including:
market demand for a specific acquisition
- potential synergies
- outlook for growth
- cost of capital
- risk factors
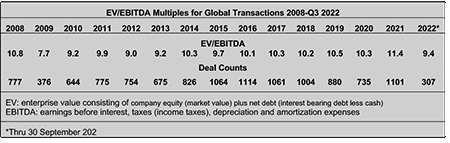
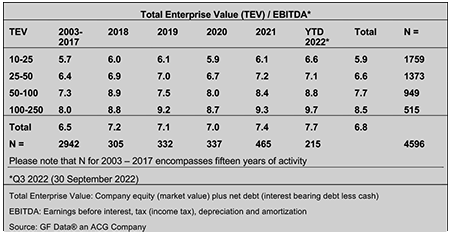
Image 4 shows the enterprise value (EV)/earnings before interest, taxes, depreciation and amortization (EBITDA) multiples for global transactions where valuations were disclosed going back to 2008.
The multiples shown in Image 4 tend to be skewed to the high end because the financial terms for smaller and private transactions are often not disclosed. Consequently, available valuation data tends to lean toward larger and public transactions. The data does indicate there has been a marked step down in valuations in this portion of the market in 2022. It would appear this segment of the M&A market is more impacted by public company valuations that have experienced multiple compression with the downturn in the public market sector valuations versus private companies, and perhaps there is an increased caution to make big bets during this time of market volatility.
There is a different valuation story in the middle and lower middle market private deal space. Image 5 shows valuation multiples for private equity transactions in the lower and middle market over multiple years. Unlike the public strategic acquirers who are experiencing multiple compression, there is still a positive multiple arbitrage available to private equity firms who can add tuck-in acquisitions to their platforms, and in the process, put some of their abundant dry powder to work.
There has also been a premium for companies with at least 10% per year sales growth and at least a 10% EBITDA margin as shown below. What has been considered a performance that warranted a premium has become more of the norm, as growth rates have improved coming out of the pandemic in 2020, 2021 and 2022.
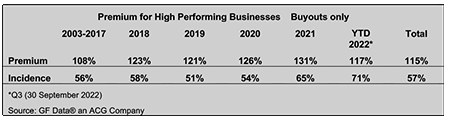
It appears the norm valuation has included the performance premium, and the decline in the performance premium in 2022 is reflecting a general compression in market valuation multiples in these segments of 4% to 12%, which is substantially less than the margin compression taking place in the larger market segment.
Fluid Handling Industry M&A Activity
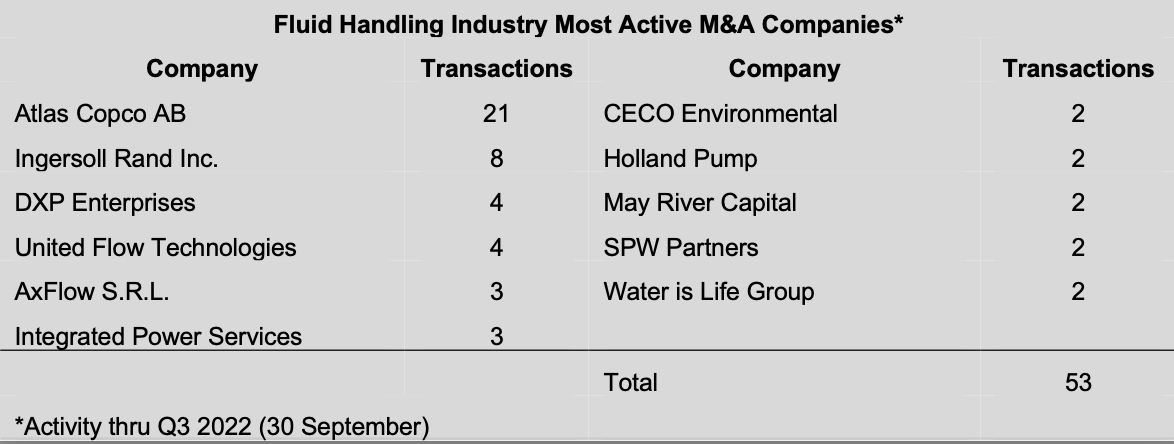
The fluid handling industry remained strong in 2022. Industry valuations remained at the high level of 2021, but activity was concentrated—11 companies accounted for 70% of the industry acquisitions through Q3 2022. Of the 11 most active acquires, five were either private equity firms or portfolio companies of private equity firms, and water was the most targeted industrial vertical.
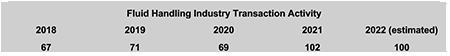
Image 7 shows the M&A activity in the Fluid Handling Industry over the last five years. The level of deal activity in 2022 remained at the record level seen in 2021. The factors driving this level of activity are the same as they have been for the last few years, namely:
- growth opportunities: additional geography, expanding addressable market, etc.
- expanding technology: address evolving market needs and wants e.g., asset monitoring, predictive maintenance
- integrating channel: mostly forward integration of distribution and service partners
- realigning portfolios (strategics)
- need to put capital to work (private equity)
- monetizing value creation (private equity and private business owners)
- retirement (private business owners)
However, the conditions that helped propel the strong market activity over the last couple years are changing as the cost of capital increases with the higher interest rates, public company multiples being compressed and the growth outlook becoming more uncertain.
Water is the Most Targeted End-Use Market
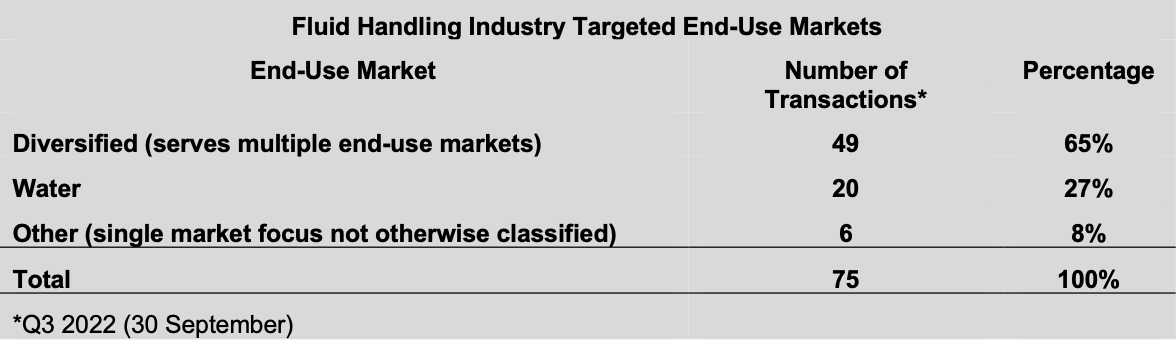
Water has been the most targeted end-use market over the last few years, replacing oil and gas, as more companies are moving to realign their markets served with what they expect to be above average growth opportunities.
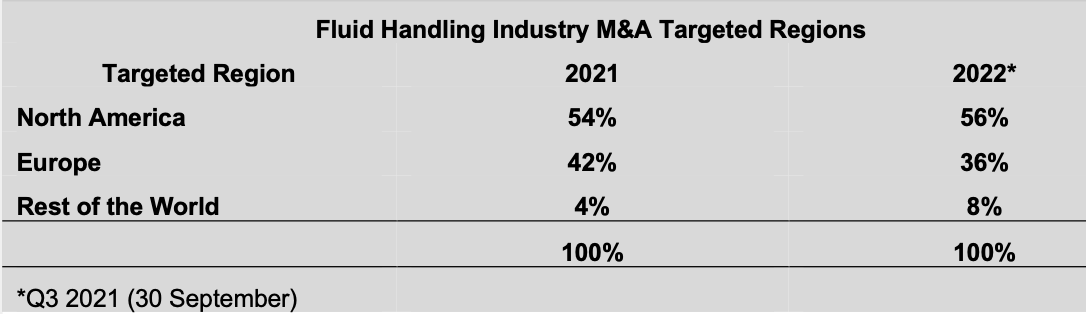
North America Is the Most Targeted Region
Image 9 shows there has been a slight shift toward North America as a targeted geography. This is not a surprise, given the current economic and geopolitical challenges in Europe. However, while the current conditions in Europe may give pause to some acquires, it is likely that multinational companies will take a long-term view versus current conditions and be motivated by their strategic imperatives in making investment decisions.
As shown in Image 10, the 11 companies that made multiple acquisitions through Q3 2022 accounted for 70% of the M&A activity in the industry. This is somewhat more concentrated than the same point in 2021 when 14 companies accounted for 65% of the activity. It is also interesting to note that of these 11 companies, five are either a private equity firm or a portfolio company of a private equity firm. Overall, private equity firms or their portfolio companies accounted for 22% of the industry buy-side activity through Q3 2022. Historically, this is a normal level of private equity activity in the industry.
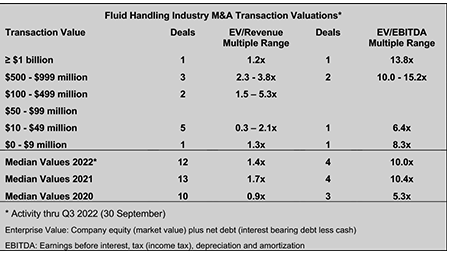
Fluid Handling Industry Valuations Remained Strong in 2022
Image 11 captures the limited valuation information available for industry transactions in 2022. The median valuation was down about 4% in 2022 versus 2021. This compares favorably (if you are a seller) with the macro numbers mentioned earlier in the article that showed a median EV/EBiTDA multiple of 9.4x, down 18% from 2021.
Thoughts About 2023 M&A
The key factors motivating buyers and sellers are still in place, including strategic buyers with strong cash flows and balance sheets to support their inorganic growth strategies and private equity firms with plenty of dry powder. However, the question is, will macro-economic factors cause buyers to pause, or at least become highly selective in the deals they pursue?
An expectation of a short and shallow recession will likely have little impact.
An expectation of a hard landing and doubts about the long-term growth outlook will likely have a significant impact.
The outlook for M&A deal activity and valuations will be driven primarily by the growth outlook more so than the impact of interest rates on the cost of capital, assuming the availability of capital is not significantly restricted.
