

Acceleration demodulation (gD) is a useful technique for anyone looking to identify an existing bearing defect. In fact, when this type of technology is properly used, there is little reason a piece of rotating equipment, such as a motor, pump, fan, compressor or gearbox, should fail without warning. While demodulation’s greatest strength lies in its ability to identify the condition of rolling element bearings, it is also a valuable tool for identifying lubrication effectiveness and improper gear meshing.
History
The birth of commercial demodulation effectively started in the mid-1980s with IRD Mechanalysis’ Spike Energy technique, which initially provided only an overall vibration measurement. After the company followed up with its Spike Energy Spectrum measurement, other vibration companies quickly looked to develop their own solutions due to the benefits end users could gain in their efforts to identify machine-related issues that could potentially cause unplanned downtime.
From bearing condition units (BCUs) to high frequency enveloping (HFE) to acceleration enveloping (gE) and now acceleration demodulation—all of them have worked well, although slight variations were used to obtain similar results. Some versions used one high-pass or multiple band-pass (BP) filters, while others gained success with using just a high-pass filter (with the Fmax acting as the low-pass filter). Signal rectification is also part of this vibration analysis technique, with companies using half-wave versus full-wave rectification circuitry. The one thing all these techniques have in common is that they produced positive results, but as a signal processing technique, several factors should be considered to yield good results:
How many different materials does the signal travel through to get to the sensor? The distance between the sensor and the defective bearing/gear will affect the results, specifically the amplitudes.
Is it mounted with a threaded stud (which offers the widest dynamic measurement range), or is the sensor mounted using another method?
Some filters can hide the defect signal by filtering out the defect energy, while others can allow the defect signal to be captured.
Overview of Acceleration Demodulation
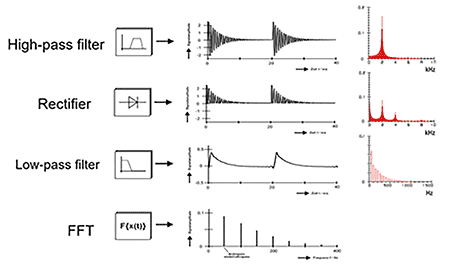
A simplified overview of the gD process goes as follows (Image 1): Apply a high-pass filter to the raw acceleration waveform to eliminate lower frequencies. Next, rectify the remaining signal. Then, apply a low-pass filter (the Fmax for the measurement), and perform a fast fourier transformation (FFT) analysis on the resulting waveform.
The following case studies show how acceleration demodulation was used to identify defective bearings in a variety of manufacturing environments.
Case Study No. 1: Defective Bearing in a Critical Motor
gD confirms a bearing defect in a manufacturing facility’s critical motor early enough to provide a five-month lead time prior to the previously scheduled repair outage in August. In this case, the combination of many measurements produced by the condition monitoring system employed by the manufacturer, a wireless micro-electromechanical (MEMS) system providing 180 readings per month for six different vibration parameters, along with steady trend plots, gave the end user the confidence to continue to operate the critical asset until the planned outage. Due to the defect identification and criticality of the motor, spare parts were on-site, and the plant’s maintenance team was ready to change out the machine in the event its condition were to degrade significantly before the planned downtime.
Thanks to the condition monitoring system’s multiple daily measurements, as well as the demodulation technology, the need for 24/7 responses to alarms on balance of plant assets with rolling element bearings could be eliminated. In this case, ball pass frequency outer race (BPFO) peaks were evident in the demodulated measurement as well as the acceleration FFT. This is typically an indication of an advanced level of defect in the bearing.
Case Study No. 2: 3,000-hp Electric Motor
A 3,000-horsepower (hp) electric motor used for turning a large fan at 890 rotations per minute (rpm) was being employed to beta test a wireless condition monitoring system. Although only one second of data was captured before the motor was shut down for repair (extensively sampled), this provided enough information to post-process the time waveform (TWF) into a gD spectrum. The ability to post-process stored data was key to identifying the issue affecting the motor. The gD spectrum clearly indicated a BPFO in the 6332 bearing, which corresponded to the photo of the defective bearing.
Case Study No. 3: Shaker Screen Bearings
A user had no online monitoring of their critical vibrating screens. When they fail, these machines present serious safety hazards as well as significant, costly downtime to the operator. To address these issues, the user decided to install a wireless, sensor-based system for this application, and the results were exceptional. The sensors are designed to withstand the extremely high g-forces inherent in this extremely challenging operating environment. A traditional wired sensor has had difficulty lasting in this application.
The interesting part of the plot (Image 2) is the insensitivity of the vibration velocity measurement to the bearing defect energy in the velocity trend plot (top section). The bearing defect energy is clearly captured in the gD trend plot (middle section).
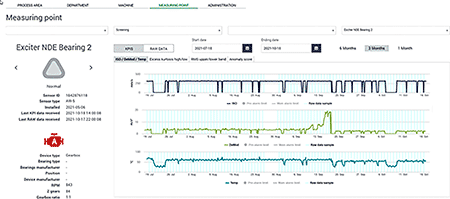
The defect worsened over a three-day period but was easily detected by the condition monitoring system that collects six sets of measurements every four hours per day. Although three days is fairly short advance notice, the maintenance team was able to plan the downtime, ensure parts and personnel were on-site and execute the necessary maintenance at the lowest possible cost to the facility.
gD using MEMS sensors (as well as standard piezo accelerometers) is still a reliable and accurate method to identify bearing-related issues. gD can help identify the status and condition of rolling element bearings, irrespective of speed and load. While speed and load can have an effect on the amplitude in these types of measurements, if a defect exists in a bearing raceway or rolling element, gD will identify the specific issue (e.g., defect in the bearing outer race, inner race, etc). This can be valuable data for performing a root-cause failure analysis (RCFA) to eliminate a particular and repeatable defect from reoccuring. If a machine regularly presents an inner race defect, perhaps this points to a housing or a fit issue. Alternatively, maybe the facility’s bearing mounting processes need to be refined, or perhaps the shaft’s roundness is an issue. Knowing the specifics behind the orign of a defect can lend a hand in the RCFA process.
Moreover, gD is typically an early identification tool that can be used to manage repair planning and scheduling. Once a defect is also visible in a standard acceleration or velocity FFT, it has advanced to the point where the repair cycle must be shortened to mitigate the possibility of expensive, unplanned downtime.
