

Total energy consumption in the United States fell to 92.9 quadrillion British thermal units (Btu) in 2020, a record 7% decline from 2019.1 Consumption decreased for all fuel sources except renewable energy, which increased by 2%. Petroleum consumption, which is primarily used in the transportation sector (one of the sectors hardest hit by the COVID-19 pandemic), decreased by 13%. Consumption of natural gas and nuclear electric power each decreased 2%, while coal experienced the largest decline of 19%.1
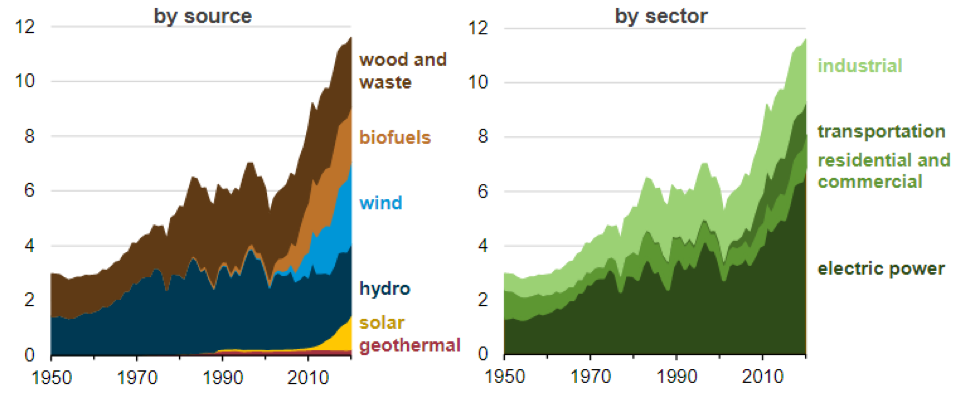
The consumption of renewable energy grew for the fifth consecutive year in the U.S. last year, reaching a record high of 11.6 quadrillion Btu or 12% of total U.S. energy consumption.2 In 2019, wind energy surpassed hydroelectricity to become the single most-consumed source of renewable energy on an annual basis in the U.S. Consumption of wind energy, or electricity generated by wind-powered turbines, grew by 14% over 2019 and accounted for almost 26% of renewable energy consumption in 2020. However, the largest increase was seen in solar energy, which grew by 22% over 2019 and accounted for 11% of U.S. renewable energy consumption in 2020.2 The chart in Image 1 details U.S. renewable energy consumption by source and sector since 1950.
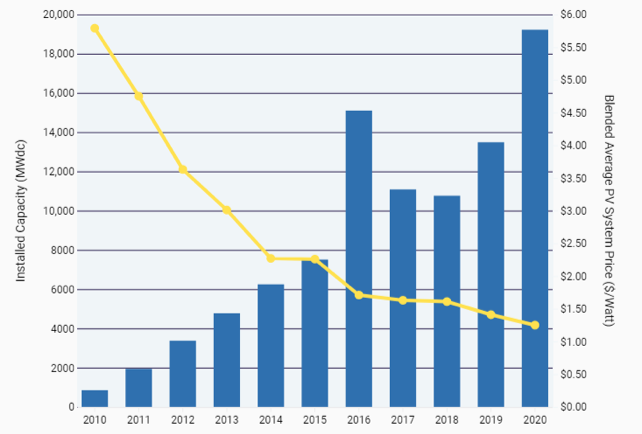
According to a new report released by the Solar Energy Industries Association, U.S. solar capacity installations are on track for record-breaking growth over the next three years. In fact, in the first quarter of this year solar installations grew 46% over Q1 2020 to more than 5 gigawatts (GW). Solar installations are on course to reach 24.4 GW this year—an increase of nearly 24% over 2020.3
Projects for utilities and other big customers made up three-fourths of the first quarter solar installations and another 77 GW of contracted installations are in the pipeline.3 Solar energy’s growth has benefitted from a long-standing federal tax credit for solar energy systems, which the Biden administration would like Congress to extend for another decade. The demand from utilities and corporations also reflects declining costs for solar technology as well as increased goals by corporations to meet greenhouse gas reductions.
The largest American-owned solar panel manufacturer, First Solar Inc. of Tempe, Arizona, recently announced plans to invest $680 million in a new factory near Toledo, Ohio. It would be the company’s third plant in Ohio and is expected to produce enough solar panels to create 3 GW of power each year—enough to power about 570,000 homes. Combined, the company’s three plants in Ohio could produce panels capable of generating 6 GW of power annually.5
Currently, First Solar employs about 1,600 people in the U.S. and 5,000 globally. The new plant is expected to employ approximately 500 workers. First Solar is a relatively small player in the U.S. market where imported products have an 85% market share. Since 2011, Chinese firms have dominated the solar market by knocking out U.S., European and Asian competitors with large-scale government support and financing.
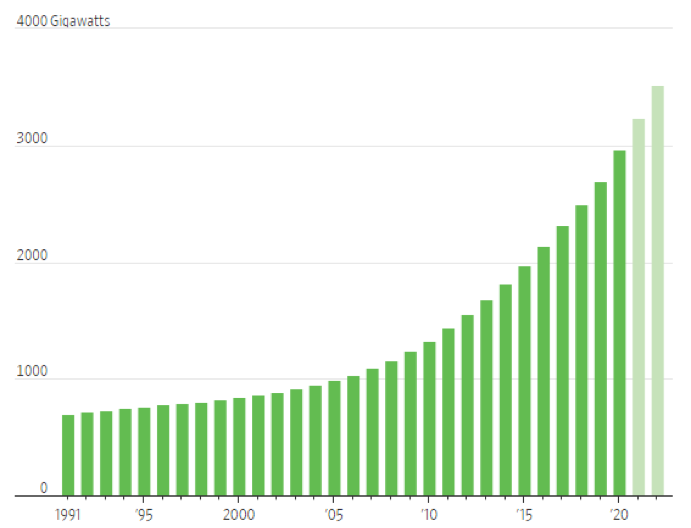
Globally, the International Energy Agency (IEA) reported that the world’s renewable power capacity grew 45% year-over-year in 2020, adding 280 GW.6 This was the largest increase since 1999, and driven in part by a need to complete projects before government subsidies elapsed in the U.S., China and Vietnam.
The IEA is forecasting the addition of 270 GW in renewable power capacity this year, and an additional 280 GW next year. Solar power is expected to play a key role in the projections for 2022, with installations forecast to be 50% higher than they were in 2019. Wind power is also expected to show strong growth over the next two years.
As government subsidies end in China, rising investments in the U.S., Europe, India and Latin America should more than offset any diminishing investments in China. The European Union plans to spend $1 trillion to reach its goal of net carbon neutrality by 2050.
However, fossil fuels are still the world’s dominant source of energy. In 2019, oil, natural gas and coal combined accounted for 81% of global energy consumption.6 By 2030, the IEA expects fossil fuel consumption to drop to 76% of total global energy consumption.
References
- U.S. Energy Information Administration, U.S. Energy Consumption in 2020 Increased for Renewables, Fell for all Other Fuels, June 4, 2021.
- U.S. Energy Information Administration, The United States Consumed a Record Amount of Renewable Energy in 2020, June 16, 2021.
- EnergyNow Media, U.S. Solar Installations Soared in First Quarter, Supply Squeeze Weighs, June 15, 2021.
- Solar Energy Industries Association, U.S. Solar Market Insight, June 15, 2021.
- The Wall Street Journal, First Solar to Build New Solar-Panel Factory in Ohio, June 9, 2021.
- The Wall Street Journal, Wind, Solar Power Made Strong Gains in 2020, IEA Says, May 11, 2021.
