

Editor’s Note: The original “Learn to Repair Pumps Properly” appeared in the January issue of Pumps & Systems. Access this article at https://www.pumpsandsystems.com/learn-repair-pumps-properly.
My January 2021 article discussed different approaches to pump repairs and upgrades. Using measured efficiency trends, estimated yearly savings from doing a repair can be evaluated.
The recently published “Vertical Turbine Pumps Repair Specification” (VPRS) presents a valuable tool in learning how to approach this issue. As beneficial as a repair can be, jumping to complete one simply because it “seems like about time” or because there is room in the budget may not always be a necessary course of action.
Part 1 of this article presented such an example. One of our readers (see below) went through a detailed analysis of the presented case in a quiz at the end of the article, concluding that payback on the economics of repairing the pump would be roughly 10 years. These days, a typical cost-value analysis needed to proceed with repairs to justify investment to save energy (restoring efficiency) is more within one to three years. Thus, even though efficiency did decline compared to the original OEM as-new condition, it did not decline enough to justify the repairs.
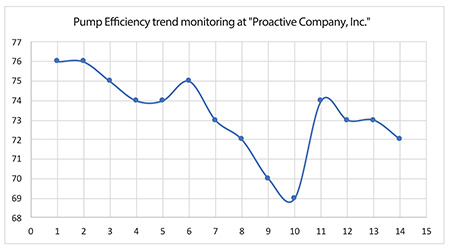
The reader, Lee Ruiz, also noted that the uptick/reversal of the efficiency decline trend shown on Image 1 at points 6 and 11 might be due to two reasons: either the pump was operated at a different flow rate during that particular measurement (perhaps closer to best efficiency point [BEP] versus previous measurement) or due to recent repairs. As my note to that, point 6 is likely attributed to operating at a different flow rate, since the efficiency change was only 1%. This is an unlikely effect of a repair, whereas point 11 (5% change) is more likely the (stronger) effect of a recent repair. I would also note that, often, the trending technique of efficiency monitoring, as shown in Image 1, is not done consistently at exactly the same flow. Practical reasons are such that it is difficult and time consuming to do a full test, throttling the flow and measuring various parameters, which takes time that operators may not have as they are too busy running the plant. Therefore, a random point (at whatever flow the pump might happen to be running at the time of measurement) is recorded.
Granted, a good apples-to-apples comparison is difficult to be ascertained in such a case, especially if only a few data points are available. However, a longer period of time (perhaps monthly recordings over two to three years) would tend to smooth out the randomness of flow variations and would create a reasonably narrow enough band to see if the overall trend is changing or remains approximately the same. Such an approach is less scientific but simpler and more practical.
I encourage users to keep referring to the VPRS, as it could be a valuable tool for maintenance and engineering departments to improve plant reliability, equipment uptime and energy-saving methods via efficiency improvements techniques. The standard can be found online at www.pump-magazine.com/pump_magazine/specifications/specifications.htm.
From Lee Ruiz of Oceanside, California
Your article, “Learn to Repair Pumps Properly” in the January issue was interesting and very useful. At the end of the article, there was a quiz question about repairing a vertical pump that now draws more amps than originally. My comments are as follows:
First off, several assumptions were made to facilitate a numerical analysis. Some of the assumptions included the motor power factor, input electrical cost per kilowatt-hour and discharge velocity.
With Article Motor & Fluid Power Head at Discharge Gauge
Using the pump head and velocity at the discharge gauge, a fluid power value of about 142 horsepower (hp) was calculated from Q H sg/3,960. Using the now 170-amp motor current, an incoming electrical power value of about 161 hp was determined from I V pf √(3)/746.
The total system now efficiency, equal to the fluid power divided by the now electrical power, turns out to be about 88%. Then, using this efficiency and the formula, 0.746 Q H sg ($/kWh) (hrs/yr)/[ 3,960 x (total system efficiency) ], the estimated annual cost of electrical energy turns out to be about $35,079/year.
Then, with the original 160-amp motor requirement, the incoming electrical power turns out to be about 152 hp and the total system original efficiency is about 93.5%. Using this efficiency, the estimated original annual cost of electrical energy is about $33,016/year.
The difference between the now and original annual cost of electrical energy is about $2,063/year. The break-even point for the proposed repair cost would occur in about $22,000/$2,063/yr ≈ 10.7 years. This seems to be too long of a payback period to justify the cost. Other additional issues, including removing or replacing this pump, could arise during this period.
If the above given and calculated values are applied to a horizontal, in-line or short-set vertical pump, these system efficiencies might be close to reflecting the actual condition. However, since this is a vertical turbine pump with a discharge gauge 30 feet above the liquid level, a closer investigation may be in order.
The actual power required to be delivered from a motor to this vertical pump can be determined by using estimated bowl head (Hb) and efficiency (Eb) values in the formula, Q Hb sg/(3,960 Eb). In addition to the head at the discharge gauge, the bowl head also includes the water level to discharge gauge elevation in addition to the vertical column liquid velocity friction losses.
After crunching the numbers, the power required to drive this pump turned out to be about 196 hp. After evaluating the pump-specific speed, the chosen bowl efficiency was then checked against a realistic value.
If the total system efficiencies are recalculated using output fluid power at the bowl, along with the now and original input electrical power values, the outcomes are both over 100%. Something is not right.
With Different Motor & Fluid Power Head at Bowl
The above motor appears to be insufficient to drive the pump. At least a 200-hp motor should work. If a 200-hp motor is used with incoming currents of 227-amps now and 214-amps original, incoming electrical power would be about 206-hp now and 194-hp original. These values yield total system efficiencies of approximately 81.5% now and 86.6% original. These efficiency values seem to be more realistic than the originally calculated 88% and 93.5%.
Now, using the total 200-hp motor and vertical pump system efficiencies, the annual costs of electrical energy turn out to be about $44,890/year now and $42,249/year original. Using the difference, $2,641/year, to determine a payback period, the result is about 8.3 years. Even though this period is shorter than the 10.7 years (w/ ~150-hp motor), it still seems too long of a payback period to justify going ahead with the repair.
System Efficiency Trend
Either the article (~150-hp) or the suggested (~200-hp) total system efficiencies can be used to monitor a pump trend similar to Image 1 in Part 1 of this column. Assuming that system performance is checked and recorded on an annual basis, the connecting curve between recordings in Image 1 may not represent actual operation or nonoperation in the interim periods.
The small trend rise at time 6 could be the result of operating closer to the pump BEP or may reflect a minor repair between 5 and 6. Likewise, the larger trend rise at time 11 could be the result of operating closer to the pump BEP or may reflect a more major repair between times 10 and 11.
To read more Pumping Prescriptions columns, click here.
