

2020 Activity Level
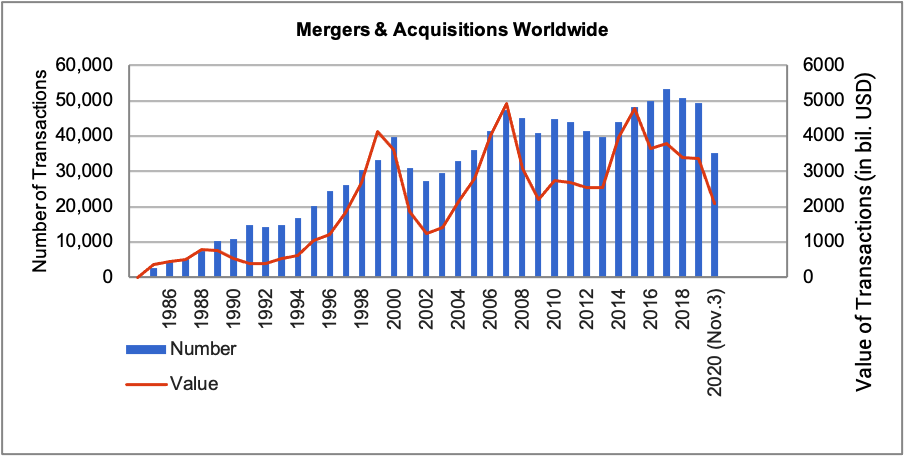
As you would expect, as shown in Image 1, M&A activity worldwide has declined in 2020 both in terms of the number of transactions and the total value of those transactions.
The bar graph shows the number of M&A transactions worldwide has been at a high level over the last five years, peaking in 2017 and reducing slightly in both 2018 and 2019. The decline is more pronounced in 2020 due to the impact of the COVID-19 pandemic. Through November 2020, worldwide transaction volume was down 15% on an annualized basis.
The line in the graph below shows transactions volume measured as the total value of the transactions. This metric is influenced by the size and valuation of transactions. As seen in image 6 enterprise valuations, the values being paid for businesses, remain strong. The conclusion when looking at this data is that while the number of deals are high, the size of the deals are smaller—more middle market or even lower-middle market transactions.
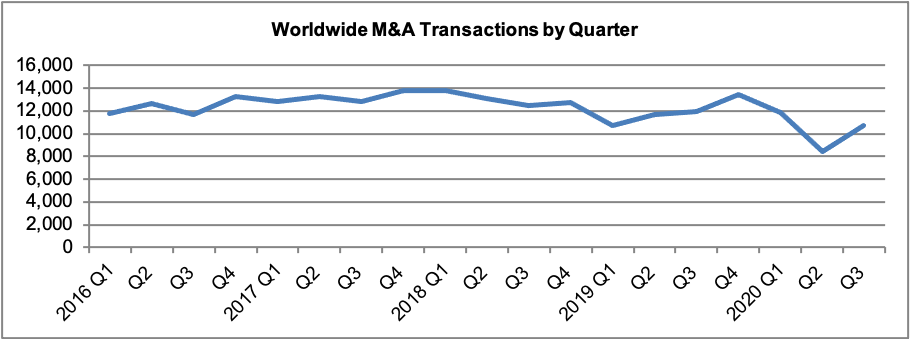
When looking at the worldwide M&A activity by quarter over the last five years, we can see that the volume of transactions was increasing through 2019 and then declined in 2020 when the COVID-19 pandemic impacted the world. We believe demand for acquisitions remains strong, which is evidenced by the uptick in activity in Q3 2020 as shown in Image 2.
Looking specifically at the M&A activity in the fluid handling industry over the last five years, we see that level of activity was steadily increasing until the pandemic-driven decline in 2020.
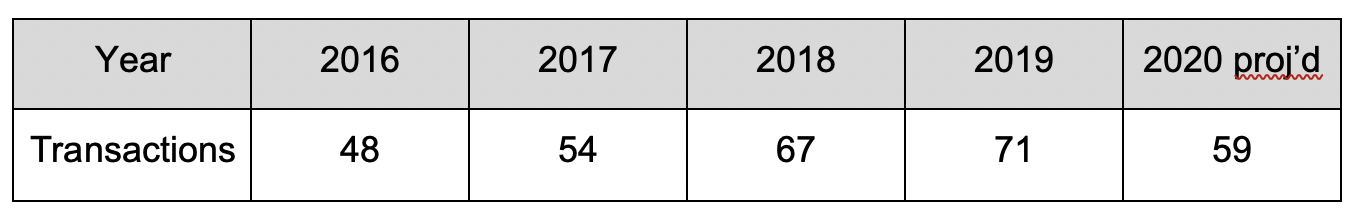
2020 did start with a high level of activity in Q1 with 19 transactions versus Q1 in 2019 with 17 transactions. However, the deal activity dipped to 12 transactions in Q2 2020 versus an average quarter of 15 transactions per quarter over the last 10 years. There was a slight increase in activity in Q3 2020 with 13 transactions. So, while activity dipped, the deal activity did not stop by any means. Based on the increasing trend, as of press time the activity level in Q4 2020 is expected to be close to the historical quarterly average of 15 transactions.

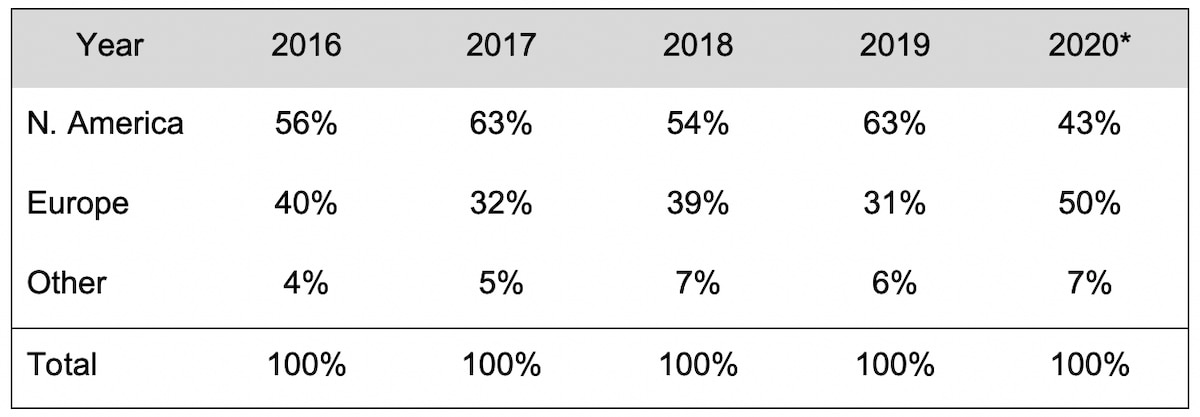
However, it is interesting to note the shift in the location of the deal activity. In the second half of 2020, 64% of the target companies were based in Europe and almost exclusively the buyers were strategic buyers with most also based in Europe. The conclusion is that the drop-off in the fluid handling industry M&A activity in 2020 was more pronounced in North American than in Europe.
Valuations at Strong Levels in 2020
General valuations remain at strong levels driven by:
- strong demand for quality acquisitions
- low cost debt
- positive growth outlook
Median enterprise value/earnings before interest, taxes, depreciation and amortization (EV/EBITDA multiples are shown in Image 6 for North America and Europe. As shown, the valuation multiples in Europe over the last five years have been lower than the valuation multiples in North America by 7% to 21%, except in 2018 when they were almost at parity.
The valuations shown in Image 6 are reflective of disclosed valuation information, which tends to be provided for public company acquisitions and, therefore, somewhat biased toward larger transactions that typically trade at higher multiples versus lower-middle market privately held companies. In Image 7 the valuation multiples for private transactions in the lower-middle market are shown.
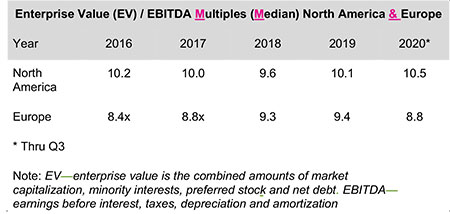
Image 6: Enterprise values for North America and Europe4 (Image courtesy of Global Equity Consulting, LLC)
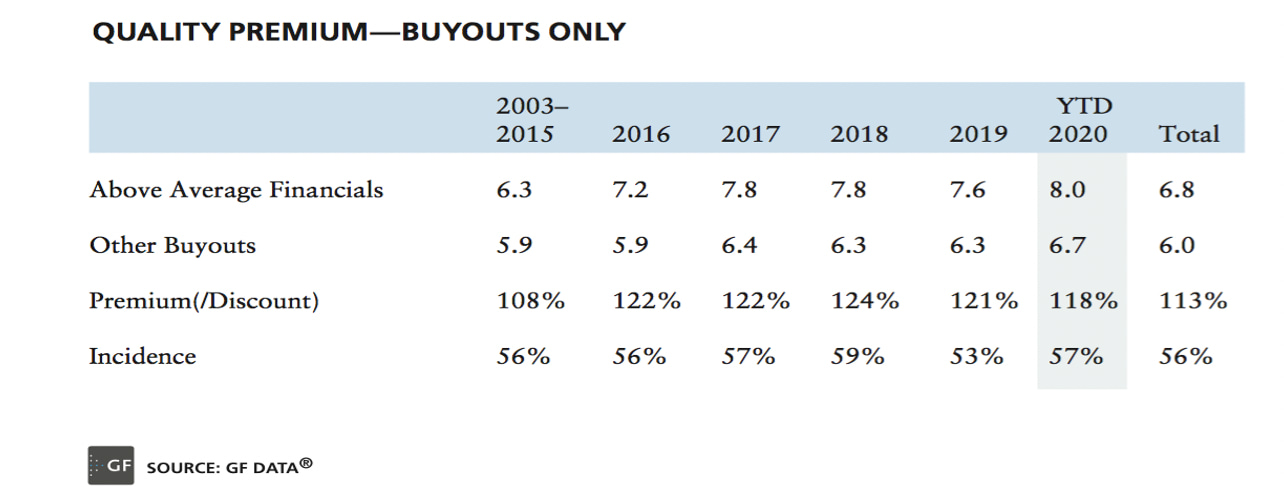
As shown in Image 7, the valuation multiples for lower-middle market companies are also at historically high levels. Image 7 shows valuations reported by private equity firms for lower-middle market transactions. This table shows that while larger companies tend to trade at higher multiple valuations, all size companies are trading at or nearly at historically high levels.

Also, the premiums being paid for companies with strong financial performance remain at relatively high levels. Above average financial performance is defined by GF Data as: trailing 12-month (TTM) EBITDA margin of 10% or greater with a TTM revenue growth of 10% or greater or one of the factors at 8% or greater with the other factor at 12% or greater.
For private business owners, there is a substantial benefit to achieving above market financial performance, especially if it can be done consistently.
Looking specifically at valuations in the fluid handling industry, Image 9 shows the median disclosed valuations for fluid handling industry transactions.
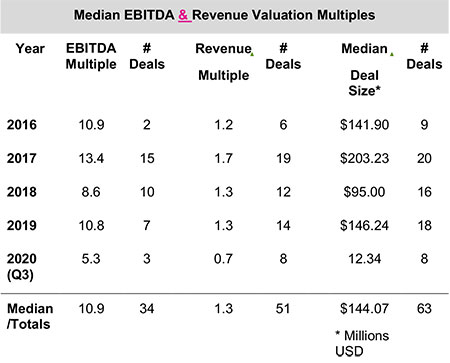 Image 9: Fluid handling industry valuations (Image courtesy of Global Equity Consulting, LLC)
Image 9: Fluid handling industry valuations (Image courtesy of Global Equity Consulting, LLC)
The industry valuations have been generally in line with the overall M&A market until 2020. However, the relatively small number and nature of the fluid handling industry transactions with disclosed valuations in 2020 would indicate these numbers are probably not fully indicative of market level valuations.
2020 Notable Transactions
1. Warburg Pincus completed the acquisition of Sundyne from funds advised by Carlyle and BC Partners. Sundyne was part of the group of companies divested by United Technologies in 2012 in a $3.46 billion transaction that formed Accudyne Industries. Sundyne was the remaining piece of Accudyne with Carlyle and BC Partners having previously sold Sullair and Milton Roy in separate transactions.
2. Funds managed by Apollo Global Management, Inc. completed the acquisition of the SPX Flow Power and Energy business segment for a transaction value of $475 million. The divested business is now Celeros Flow Technology and consists of the following brands: Airpel, Copes-Vulcan, GD Engineering, Plenty, ClydeUnion, Dollinger, M&J Valve and Vokes.
3. Private equity firm KKR sold 12,100,000 shares of Ingersoll Rand common stock at $30.70/share in a registered secondary offering. This transaction flows from KKR’s ownership of Gardner Denver and the merger of Gardner Denver with the industrial division of Ingersoll Rand, which recently acquired Precision Flow Systems (Milton Roy, LMI, Haskel, BuTech, Dosatron, YZ Systems, Williams and Hartell). Those combined businesses now trade on the NYSE under the symbol IR. Ingersoll Rand has spun off its air conditioning and refrigeration business into the publicly traded Trane Technologies (NYSE: TT).
4. The Weir Group PLC has entered into an agreement for the all-cash sale of its oil and gas division to Caterpillar Inc. for an enterprise value of $405 million (£314m), subject to customary working capital and debt-like adjustments at closing This follows the announcement in February 2020 that Weir would seek to maximize value from its oil and gas division as it continued its strategic transformation into a premium mining technology pure play.
References
- The Conference Board Global Economic Outlook, 28 October 2020.
- Institute for Mergers Acquisitons and Alliances M&A Statistics, (https://imaa-institute.org/)
- GF Data Resources, LLC, November 2020 M&A Report
- PitchBook Q3 M&A Reports for North America and Europe
