

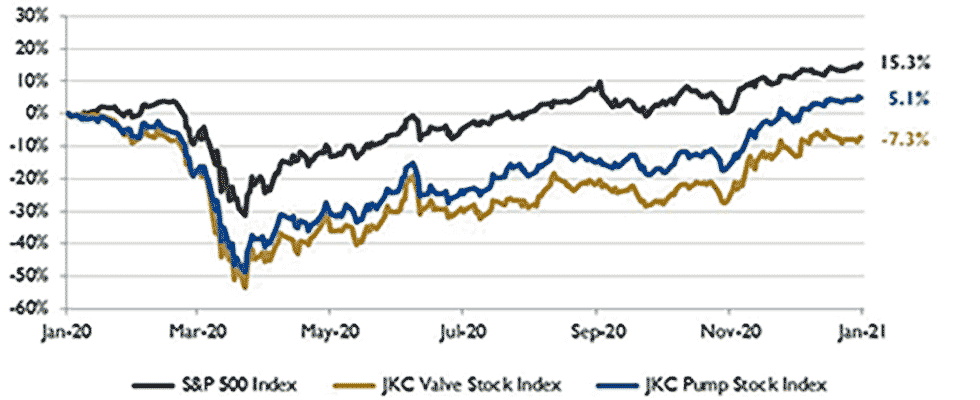
The Jordan Knauff & Company (JKC) Valve Stock Index was down 7.3% over the last 12 months, while the broader S&P 500 Index was up 15.3%. The JKC Pump Stock Index gained 5.1% for the same period.1
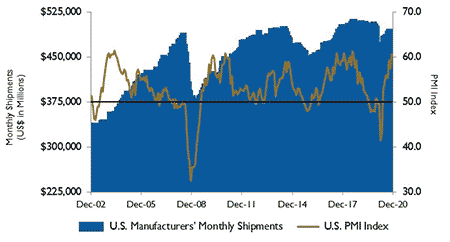
The Institute for Supply Management’s Purchasing Managers’ Index (PMI) jumped to 60.7% in December from 57.5% in November. The manufacturing sector is benefiting from the pandemic-induced shift toward spending on goods versus services. The production index rose to a near decade-long high of 64.8% and may stay elevated over the near-term as the new orders index grew to 67.9%.
The backlog of orders continues to grow, up 2.2 points to 59.1%. There was a 12.2-point jump in the prices paid index to a two-and-a-half-year high of 77.6%, with no commodities reported down in price.
The employment index rose back into positive territory at 51.5%, after falling into contraction territory in November. Industrial production increased 0.4% in November. After falling for three consecutive months, motor vehicles and parts shot up 5.3%, while mining added 2.3%. Manufacturing, which is three-quarters of all industrial output, grew 0.8%. Manufacturing output is still about 5% below its pre-recession high set in December 2018.
The U.S. Energy Information Administration (EIA) estimates that U.S. crude oil production was 11.2 million barrels per day (b/d) in November, up from 10.9 million b/d in September. The increase reflects greater production in the U.S. federal Gulf of Mexico after hurricane-related disruptions.
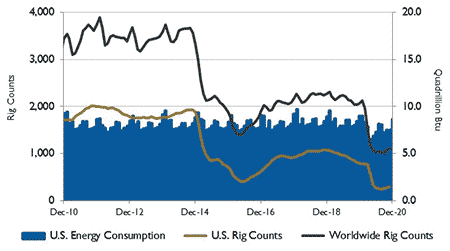
The EIA expects that U.S. crude oil production will decline to less than 11.0 million b/d in March 2021 due to falling production in the lower 48 states, where declining production rates at existing wells are expected to outpace production from newly drilled wells in the coming months.
As drilling increases in response to rising oil prices, crude oil production in the lower 48 states is expected to increase from 8.7 million b/d in February to 9.1 million b/d in December 2021, with total U.S. crude oil production reaching 11.4 million b/d. The EIA expects U.S. total crude oil production to fall from 12.2 million b/d in 2019 to 11.3 million b/d in 2020 and 11.1 million b/d in 2021.
The Dow Jones Industrial Average, the S&P 500 Index and the NASDAQ Composite rose 3.3%, 3.7% and 5.7%, respectively, in December as the first doses of the COVID-19 vaccine were rolled out in the U.S.
For the year, the Dow and S&P 500 gained 7.3% and 16.3%, respectively. The NASDAQ had its best year since 2009, gaining 43.6%. The Federal Reserve Bank’s stimulus package helped markets rebound sharply from record lows set in February and March. The S&P 500 gained 66% from its March 23 low. The technology and consumer discretionary sectors were the largest gainers of the year.
Energy was the worst performing sector among the 11 major sectors of the S&P 500.
