

Process pumps are machines that take liquid from a suction condition to a discharge condition. In its typical form, there usually is a shaft-mounted impeller (or impellers) that, together, make up a rotor. Impellers impart velocity to the fluid as it passes from pump suction to pump discharge. Whereas in the pump casing’s internal passageways, the fluid velocity decreases and is converted to an elevated discharge head.
However, the resulting pressure is a function of the specific gravity of the product being pumped and the expression “head” is a universal indicator of the pump’s output. The height to which a droplet of water can be lifted as it leaves the tip of an impeller is determined strictly by the circumferential velocity with which the droplet leaves the tip. That velocity is a function of impeller diameter and shaft rotations per minute (rpm). Translation: At a certain speed and for a certain impeller diameter, a droplet of water with a specific gravity (SG) of 1.0 will be propelled to a height of, say, 100 feet (ft) and so would a droplet of mercury, which has an SG of 13.6. Comparing the pressure exerted by a column of mercury Y feet high with that of an equal-height column of water, the former would be 13.6 times greater than the latter, as would the power demanded to produce equal heads.
A certain pressure is needed to force a quantity of liquid into the eye of an impeller. The force (or pressure) also must overcome casing and pipe friction while creating a head of a certain magnitude. To design and manufacture a pump defined by needed flow and pressure, the OEM will propose a pump with an impeller requiring a designed-in net positive suction head (NPSH). The plant design needs to provide an available head or driving force (NPSHa) in excess of NPSHr (required). If there is no reasonable increment of NPSHa over NPSHr, the pump will cavitate and, other parameters remaining unchanged, the possible operating hours of the impeller(s), bearings and seals will be reduced. If a plant designer insists that a low NPSHa must be accommodated, the manufacturer’s offer will likely contain compromises or constraints that are of consequence to the buyer.
For decades, it had been incorrectly assumed and taught that a 1 foot (ft) incremental head difference was all that was needed. With evidence mounting that, for ammonia and other aqueous liquids, even 20 ft was barely enough and a multifaceted problem had to be faced nearly 100 years ago. It may require an NPSHa from two to 20 times NPSHr to fully suppress cavitation within a pump. Much depends on pump design, flow ratio (percentage of best efficiency point [BEP] flow) and how close the liquid’s temperature is to its vaporization temperature. Whatever fraction of driver power is converted into heat rise must not elevate temperatures to cause portions of the liquid to vaporize.
Cavitation Explained3
Cavitation is the effect of vapor bubbles collapsing and giving way to the surrounding liquid impinging on portions of the pump impeller. Collapsing bubbles cause variations in pump discharge pressure, which prompted interested parties to agree that a 3% fluctuation of discharge pressure indicated the onset of cavitation. However, by the time it becomes clear from a discharge pressure gauge needle, which hovers or jitters nervously between 100% and 97% of normal discharge pressure achieved, it is best to pay attention. Although industry calls it the onset of cavitation, destructive vibratory forces and impingement by collapsing vapor bubbles may already be well underway.
The pressure gauge needle dance is caused by collapsing vapor bubbles, which are accompanied by tiny high-velocity fluid jets that strike at points where collapsing bubbles contact impeller vanes or other internal surfaces. The struck material will erode, leaving behind millions of cavitation pockets. The extent of cavitation-induced damage differs, thus materials are classified in accordance with life factors. Mild steel is ranked lowest with an assigned number of 1. Aluminum-bronze tops the list of cavitation-tolerant materials with an 8, while stainless steels (4) are near the middle.
NPSH Plots
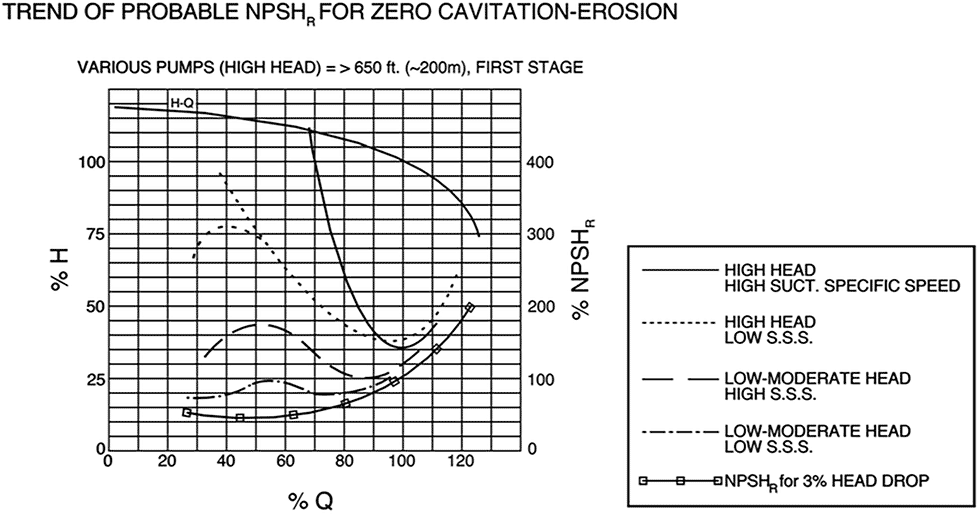
Next came the belated emphasis on where NPSH differential head plot lines should intersect the vertical (Y-axis) of such plots. Since about 1960, many researchers found this tends to vary greatly and none intersected the vertical axis (Image 1). Curve trends varied with pump suction specific speed (Nss), which is calculated by taking the quantity (rpm [gpm per impeller eye])^1/2 and dividing it by (NPSHr)^3/4. Still, many phantom plots created the impression that operation at almost zero flow would be allowed and would result in a low delta NPSH requirement. But low flows cause pump-internal recirculation, which also creates vapor bubbles and curtails pump life.
The onset of such internal recirculation is related to the Nss. In the 1970s, BP-Amoco published the results of a survey that showed that pumps with an Nss greater than 12,500 suffered from above-average failure frequencies. Other pump users wanted to be even more conservative and issued Nss specification requirements as low as 8,500. If the pump manufacturer designs an impeller to meet this stipulation, the pump will have a rather narrow allowable operating range. However, there are pumps in certain services where an Nss of 14,000 and even 15,000 is not a problem. Manufacturers will occasionally point to such an installation. But generalizations and extrapolations are not always the recommended course of wisdom.
Today, permissible operating ranges are shown on American Petroleum Institute (API)-compliant pump curves. These curves help in extending the life of hydraulic components but leave it to pump users to specify desirable above-average lube application methods. Although centrifugal pumps are the simplest fluid machines available in industry and hundreds of millions are in service worldwide, quite a few of them fail randomly. And yet, it is a fact that most process pumps typically have fewer than 100 parts, whereas a reliable aircraft jet engine typically has more than 8,000 parts.
Suction Energy3
In the first decade of the 21st century, pump manufacturers teamed up with the Hydraulic Institute (HI) to better understand NPSH-related pump failure issues. Their cooperative efforts culminated in recommending NPSH ratio margins based on the suction energy level of a pump. Suction energy is the amount of energy associated with the collapse of vapor bubbles; it determines the degree of noise, vibration and damage to surfaces. It is calculated by multiplying four factors:
- De—the impeller eye (inches)
- N—the pump speed (rpm)
- Nss—the pump suction specific speed
- SG—specific gravity of the liquid being pumped
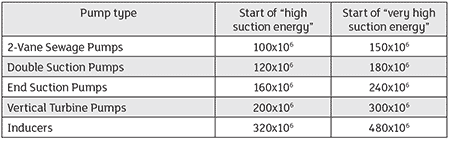
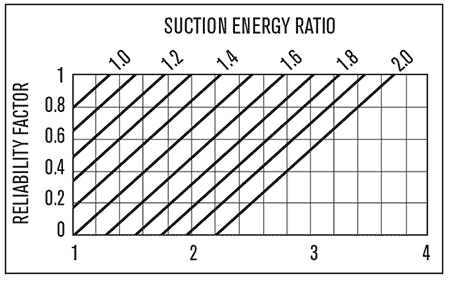
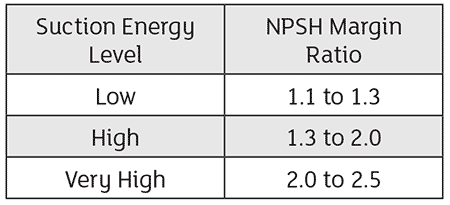
Image 3 indicates pump types and suction energy categories. Image 4 summarizes the minimum NPSH margin ratio guidelines (NPSHa/NPSHr) that are applicable within the allowable operating regions of a pump1,2. An NPSH margin ratio is plotted on the horizontal and a reliability factor on the vertical scale of Image 2 for various suction energy ratios. While each table and illustration comes into play, it should be noted that actual field NPSH margins may differ from the originally calculated value. This can be attributed to an assortment of uncertainties, such as:
- The accuracy of the NPSHr test originally performed by the vendor. Even an NPSHr test performed to HI standards has an allowable tolerance.
- Any flow disturbances in the inlet piping to the pump
- The air content of the liquid
- The liquid temperature
Suction Energy Discussed3
Recall that Images 3 and 4 dealt with pump types and suction energy levels. Image 2 depicts an NPSH margin reliability factor developed from field experience and guidelines from Image 4. Image 2 provides a reasonable approximation of the reliability that can be expected for aqueous liquids when various NPSH margin ratios are applied to high suction energy pumps of increasing suction energy ratios. NPSH margin reliability factors are based on the fact that, above the gating suction energy values (start of high suction energy, see Image 3), cavitation becomes severe. In other words, the greater the suction energy, the more important it is to suppress the damage-inducing residual cavitation that exists above the NPSHr. This reliability factor is only applicable within the allowable operating flow region, above the start of suction recirculation. Higher NPSH margin values are required in the region of suction recirculation for high suction energy pump applications.
Sample calculations are found in the “Pump User’s Handbook—Life Extension.” These calculations culminate in determining a total hydraulic reliability factor (Rt). This factor is obtained by considering a speed reliability factor1, a reliability factor associated with flow, and factors influenced by the margin ratios in Image 2. A sample calculation for Rt is among many that show how pump owners can compare competing pump offers. Of course, we cannot claim to know more about NPSH than researchers who spent decades on the subject. Nevertheless, it is evident from field experience that learning more about NPSH is a highly worthwhile undertaking.
References
- Heinz P. Bloch and Allan R. Budris; “Pump User’s Handbook—Life Extension,” 4th Edition (2013); Fairmont Press, Inc., Lilburn, GA; also, Taylor & Francis, London, UK, ISBN 088173-720-8 (Fairmont Press) and 978-1-4822-2864-9 (Taylor & Francis, Ltd.).
- Allan R. Budris; “Cavitation Problems?” Plant Services, August 1997.
FOOTNOTE
3 – In subsequent editions of the HI standard, HI published guidelines for NPSH margin moved away from suction energy and are now based on application, operating point, and other design considerations. Refer to ANSI/HI 9.6.1-2017 for the latest recommendations from the Hydraulic Institute.
