Part 1 ran in the February 2026 issue of Pumps & Systems.
Where Should the Rated Flow Lie?
This section will examine how the region of rated flow between 80% and 110% of best efficiency point (BEP) flow rate could be constructed for all available impellers and what it would look like.
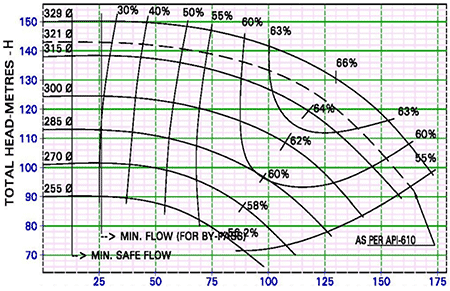
This example will use the following family of performance curves for a pump model:
- Impeller diameters: 255-329 millimeters (mm)
- Efficiency: 56.2%-66%
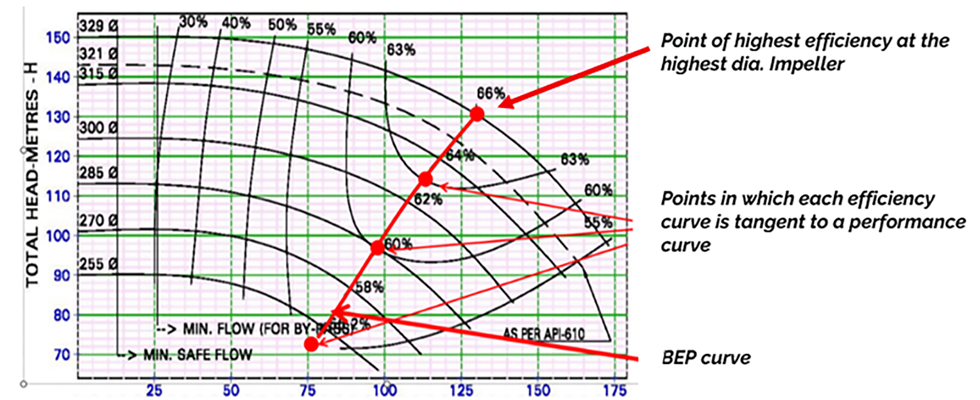
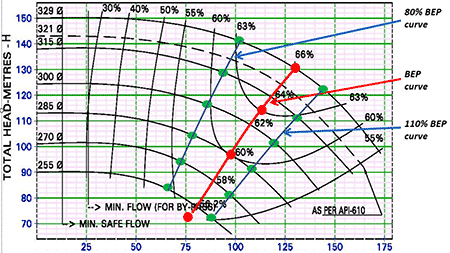
First, find the point of highest efficiency at the highest diameter impeller. Next, find the points in which each efficiency curve is tangent to a performance curve, e.g., 60% efficiency is tangent to a diameter (D) 285 mm performance curve at the red point indicated (Image 2).
Connecting those points results in the BEP curve, the most important curve of the pump.
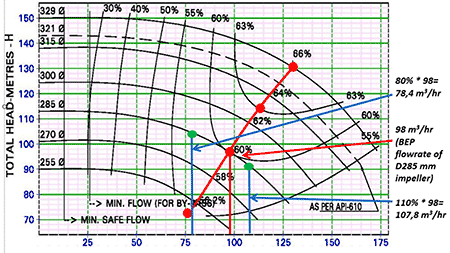
Then find the 80% and 110% points on each performance curve. For example, at the performance curve of D285 mm:
- BEP at 98 cubic meters per hour (m3/hr)
- 80% at 78.4 m3/hr
- 110% at 107.8 m3/hr
Similarly, find the 80% and 110% points of the performance curves of all available impellers. Connect them to get the 80% BEP curve and 110% BEP curve.
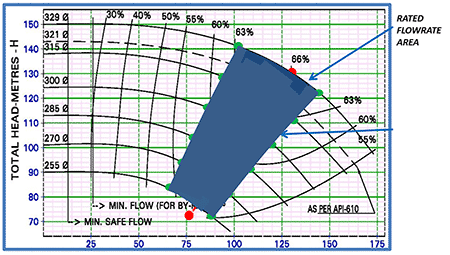
This results in the rated flow area (RFA) of all the available impellers of this pump model. The RFA indicated on the pump data sheet should lie somewhere in this area. The RFA is clearly much smaller (20%-25%) than the area between the minimum safe flow at the left and run out flow at the right.
Why Is the Rated Flow Area Important?
By recognizing the RFA, the engineer obtains the range of flow rate/head values within which the rated flow of the pump to be selected should lie. Even in case the specified flow rate/head values fall between the curves of two impeller sizes, this situation can be approached by trimming the larger impeller.
If the BEP of the selected pump is far away from the rated flow, then unsurprisingly, the pump will most likely operate outside the preferred operating range (POR) as well.
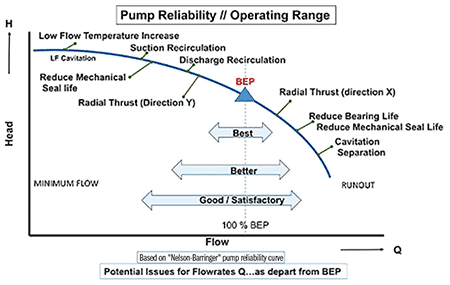
Example: A pump is selected whose rated flow rate is 75% of BEP flow rate. If the actual pump flow rate fluctuates within ±20% (a reasonable assumption), then the pump will operate between 60% and 90% of BEP flow rate, i.e., outside the 70%-120% limits. As the actual flow rate is reduced under 70% or increased over 120%, several failures will occur, as depicted by the graph in Image 6. In addition, the further the pump operates from the BEP, the higher the amount of energy it consumes.
Pump manufacturers publish their performance charts depicting the allowable operating region as they should, but this often is not the region where the rated flow should lie. It is upon the purchaser’s engineer to study the detailed performance curves of the pump, recognize the RFA as a decision-making tool and make sure the rated flow indicated on the pump data sheet lies on this area.
For more on pump selection, visit pumpsandsystems.com/tags/pump-selection.