First of two parts. Read part 2 here.

Prior to starting any new program, financial justification must be made. This column explains how to justify projects using readily available plant production data.
I follow two rules for any process improvement:

  • If end users do not measure it, they cannot 
improve it.
  • If operators/end users do not know how much a process costs, they cannot maximize its profitability.

Most businesses have accounting departments that track the flow of money into (revenue) and out of (expenses) the company. The difference between revenue and expenses is the company’s profit. Periodically, the accounting department reports all revenue and expenses on a balance sheet for a concise picture of the financial health of the company.

How does a process plant account for the revenue and expenses for each product? My experience is that most companies do not carry accounting to this level, most likely because of the assumed complexity of a pump system. One reason is the minimal amount of operation information available because of the expense of gathering and recording data. Another reason is that many do not know how to interpret the data. As a result, much of the operational information needed is not readily available.

Using the vat dilution system discussed in “Solution for Pump Discharge Pipe Cracking” (January 2014, Pumps & Systems), the integrated paper mill did not know the total cost of operations. This inaccurate information is the primary reason the problem persisted. If plant management realized that the outages cost more than $440,000 per year, the problems probably would have been corrected sooner.

Improvement Program Objective

The objective of a system improvement program is to have the same attention to detail on improved pumped system profitability as is expended in increasing total plant profitability.

Within a typical industrial plant, 20 percent to 50 percent of the power consumed is for pumping applications1, and these systems have an average efficiency of less than 45 percent.2 Is that sufficient incentive to consider improving pumped systems? In the column from January 2014, the plant saved money by improving system operations, but the major problem with that application was deciding what needed to be improved. To demonstrate how to determine the value of implementing a pump system improvement program, we will look at a typical industrial plant in the Northwest.

Plant Case Study

In 2005, an industrial process plant was scheduled to operate for 340 days with 25 days for planned shutdowns (allowing the plant to operate 93 percent of the year). Based on 2005 operating records, the plant operated for 7,440 hours (85 percent uptime). During that time, it produced 138,500 tons of products. Based on tons produced and operating hours, the production rate was 18.6 tons per hour, and revenue was $72,000,000.

Using the plant’s financial data, along with the 2005 production numbers, operators determined the revenue, expense and profit numbers per ton of product, as outlined in Table 1.

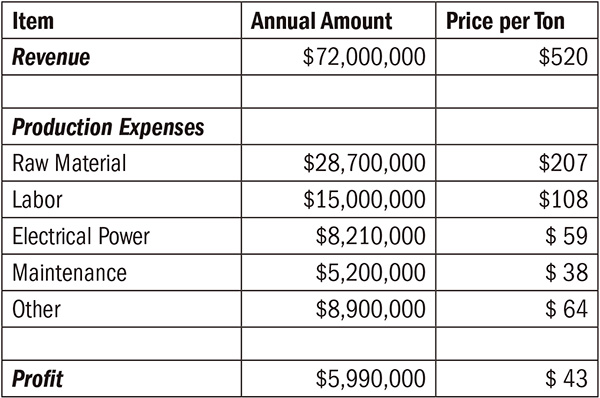
Table 1. A financial balance sheet shows the revenue, production expenses and profit for an industrial process plant in the Northwest.

Now that the plant’s financial numbers were established, operators determined the value of the pump system improvement program. To accomplish this, the operators approximated the total cost to operate the plant’s systems. Then they could arrive at a realistic saving estimate and determine if the estimated savings were worth the cost and effort of implementing the improvement program.

Electricity is used for powering pumps, fans, compressors and conveyers and is used for lighting, heating and drying operations. The first task was to determine the percentage of the plant’s total electrical power used for the pump systems.

To determine this, the operators looked at the plant’s electrical distribution system. All plant electrical power travels through a system of switchgear and motor control centers. Plant designers calculated the capacity required for each plant load and sized the distribution system accordingly. The description and size of each electrical load in the switchgear and motor control centers were listed in the plant’s design documents. The operators could easily review the list, identify the loads supplied to the pump motors and compare it with the total plant electrical loads to arrive at the pump percentage.

In this case study, the plant’s total electrical capacity for all switchgears and motor control centers was 61,500 kilowatts. The total capacity for all motors driving pumps was 15,400 kilowatts. As a result, the design load for motors driving pumps was approximately 25 percent of the plant’s total electrical design loads (see “The Accuracy of Estimates”).

From this ratio, the operators could estimate that the pumps consume 25 percent of the plant’s total electrical power, which correlates with information provided by the U.S. Department of Energy.3 Using this ratio, the cost for the electrical power required for the pump motors was:

$59 per ton x 25 percent for the pumps = 
$14.75 per ton for pumping power cost

With accurate maintenance records, end users can extract the maintenance cost of the plant’s pumped systems. If maintenance costs are not readily available, an estimate needs to be developed (see “The Accuracy of Estimates”). Because electrical power operates most mechanical equipment, end users can assume that the ratio of pump maintenance costs to the plant’s total maintenance costs is the same order of magnitude as the ratio of pump power consumption to total plant power consumption.

For example, the pumped systems consumed 25 percent of the plant’s electrical energy. The operators could assume that 25 percent of the total maintenance costs is for pumped systems. The maintenance costs were approximately:

$38 per ton x 25 percent for pumps = 
$9.50 per ton for pump maintenance

Click here to read part 2 of this article.

References

  1. Tobias Fleiter, Wolfgang Eichhammer, Joachim Schleich. “United Nations Industrial Development Organization: Energy efficiency in electric motor systems: Technical potentials and policy approaches for developing countries,” Working Paper 11/2011.
  2. Erkki Jantunen, Kirsi Vaha-Pietila & Kimo Pesonen Technical Research Center of Findland, Manufacturing Technology. VVT Symposium 172, Comadem 1997, “Expert System for the Diagnosis of the Condition and Performance of Centrifugal Pumps.”
  3. “U.S. Industrial Motor Systems Opportunities Market Assessment,” U.S. Department of Energy, Oak Ridge National Laboratory, Xenergy, Inc., December 1998.

The Accuracy of Estimates

The financial justification for starting a pump system improvement program uses estimated data. The accuracy of any estimate is subject to question. This sidebar discusses the assumptions made and their validity for the estimates.

The percent of power going into the motors that drive pumps is based on the design load on the motor control centers and switchgear. These numbers may be greater than the actual numbers because of the design margin used when sizing electrical loads. However, if the same magnitude of design margins for all electrical load calculations are assumed, the percentage of pump power to total power should hold true.

When estimating maintenance savings, the same percentage is used as that of power savings. One may question the validity of basing the maintenance savings as a function of the power savings. However, pumped systems are typically oversized. Because of this, the following logic path describes how energy savings and maintenance savings are closely related:

  • Most pumped systems have a design margin used in pump selection, resulting in oversized pumps.
  • Oversized pumps produce greater head than required by the system.
  • Excess head requires additional electric energy to drive the pump.
  • Excess energy increases the hydraulic energy of the process fluid.
  • To control the system to a set value, a control valve must remove the excess fluid’s energy, resulting in heat, noise and vibration. This causes increased wear and tear on the components and increased maintenance costs.

These estimates establish the financial justification for the system. Once a plant implements an improvement program and makes system improvements, the savings are documented and that information is used for future estimates.

Maintenance and operating costs can be determined using readily available plant operating and financial data. Part Two will discuss using this financial data and the plant’s energy reduction goals to estimate how much a pump system improvement program will increase profitability.