
Pump System Improvement
08/02/2016
Editor’s note: This article provides additional information that further explains Ray Hardee’s monthly Pump System Improvement column appearing in the August 2016 issue. Click here to read it. Figure 1 shows 12 circuits of a much larger cooling water system. Like all piping systems, the total system consists of the pump elements, process elements and control elements. Each circuit in the system has each of the three elements. To demonstrate, we will follow the circuit on the right side of Figure 1.
 Figure 1. An example of the cooling water system described in this column (Courtesy of the author)
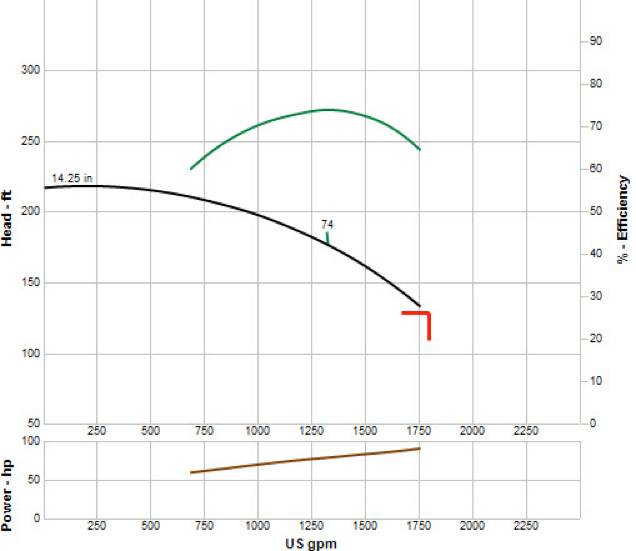 Figure 2. The pump curve for one of the operating cooling water pumps running prior to the loss of the cooling water pumps
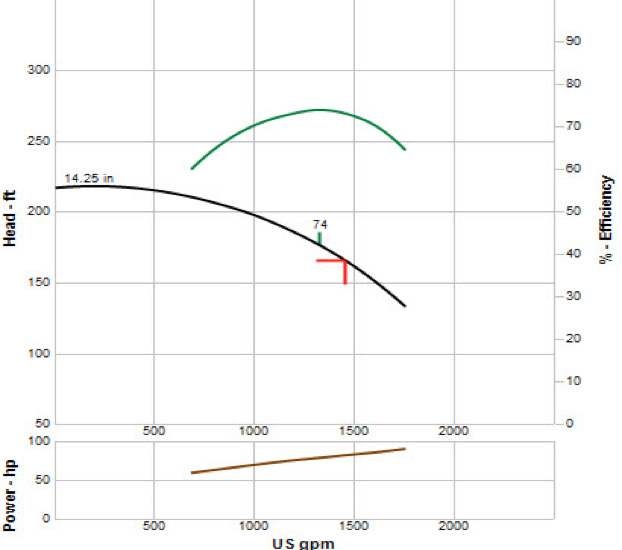 Figure 3. The pump curve for one of the operating cooling water pumps running after the third pump is operated
Checking the Results
The team decided not to change the position of the throttle valves when the plant was operating to prevent downtime. During a planned weekend outage, all the throttle valves in the cooling water system were set to the calculated position. To make sure the system was balanced, an ultrasonic flow meter was employed to validate the flow rate though each circuit with only two cooling water pumps operating. The test results of the physical piping system matched the design flow rates, indicating that the system was in balance. The test showed that the flow rate was balanced, but to ensure all heat exchangers met the thermal transfer requirement of each circuit, an operation test was planned when the plant was back in operation. Once the plant was in operation with only two active pumps the engineers checked the outlet temperatures of all heat exchangers. With the exception of two heat exchangers, the outlet temperatures were within the allowable temperature. The two heat exchangers with high temperatures and the design flow rate indicated that the heat transfer within the heat exchanger was not as designed. To ensure the plant operated properly, they increased the flow rates through the two heat exchangers until the outlet temperature was within the allowable range. By adjusting the throttle valve position on the two circuits that had problems with their heat exchangers, the plant engineer could determine how changing the flow rate through the two loads would affect the operation of the remaining circuits in the system. To accomplish this, he positioned all the throttle valves to the final position and performed a system simulation. The calculated results of the piping system model indicated that the calculated flow rates through each circuit were well within the range of system operation.
See more Pump System Improvement articles by Ray Hardee here.
