Pump Market Analysis

The Jordan, Knauff & Company (JKC) Valve Stock Index was down 12.2 percent over the last 12 months, while the broader S&P 500 Index was down 2.0 percent. The JKC Pump Stock Index also decreased 19.2 percent for the same time period.

Manufacturing activity improved for the second month in a row with the Institute for Supply Management's Purchasing Managers' Index (PMI) registering 50.8 percent in April. Expansion continued in new orders, production and backlogs. For the month, 15 of the 18 industries reported an increase in new orders (up from 13 in March) and production (up from 12 in March). For the second consecutive month, the export orders index was above 50, reaching 52.5 in April, its highest level since November 2014. Although the employment index rose 1.1 percentage points to 49.2 percent over last month, it remained at contraction levels.

Figure 1. Stock indices from May 1, 2015, to April 30, 2016
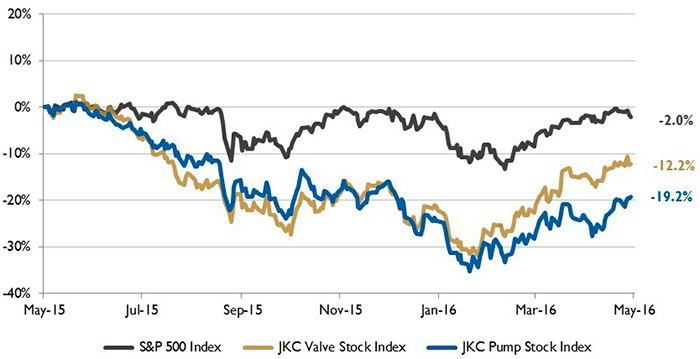
Figure 1. Stock indices from May 1, 2015, to April 30, 2016. Source: Capital IQ and JKC research. Local currency converted to USD using historical spot rates. The JKC Pump and Valve Stock Indices include a select list of publicly traded companies involved in the pump and valve industries weighted by market capitalization.

The Bureau of Labor Statistics reported that the U.S. economy added 160,000 jobs in April, a seven-month low. The unemployment rate was unchanged at 5 percent. The largest employment gains were seen in professional and business services (65,000), as well as education and health services (54,000). Government jobs fell by 11,000, mining by 8,000 and retail by 3,000. Manufacturing and construction jobs increased by 4,000 and 1,000, respectively.

According to the Bureau of Economic Analysis' first estimate, U.S. gross domestic product grew at an annual rate of 0.5 percent in the first quarter of 2016. Business fixed investment, which includes spending on equipment, structures and intellectual property, fell by a 5.9 percent annual rate, the largest decline since the second quarter of 2009. Led by services, consumer spending increased at a 1.9 percent annual pace. Showing continued momentum in housing recovery, residential investment was up 14.8 percent, the second consecutive month of double-digit gains.

Figure 2. U.S. energy consumption and rig counts
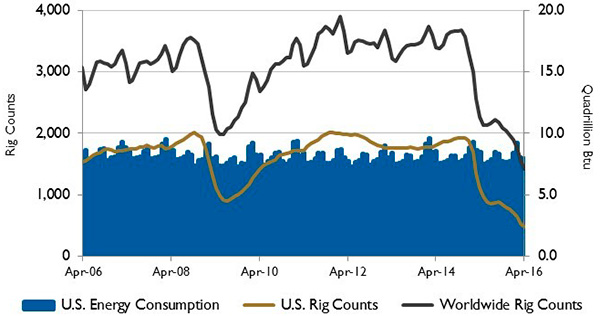
Figure 2. U.S. energy consumption and rig counts. Source: U.S. Energy Information Administration and Baker Hughes Inc.

For the sixth consecutive year, U.S. total energy production increased in 2015, according to the U.S. Energy Information Administration. Crude oil production increased by 8 percent, natural gas plant liquids increased by 9 percent, and natural gas production increased by 5 percent for the year. Coal production declined by 10 percent. U.S. primary energy consumption declined 1 percent in 2015, with the residential and commercial sectors declining by 9 percent and 6 percent, respectively, due to milder winter weather during the year. Transportation sector consumption rose by 2 percent.

On Wall Street, the Dow Jones Industrial Average gained 0.3 percent, the S&P 500 Index gained 0.5 percent and the NASDAQ Composite fell 1.9 percent. It was the first three-month positive stretch for the Dow Jones Industrial Average since January 2014, while for the first time this year, the S&P 500 Index gained for a second straight month. First quarter corporate earnings results were mixed and had a negative effect on the indices.

Figure 3. U.S. PMI and manufacturing shipments
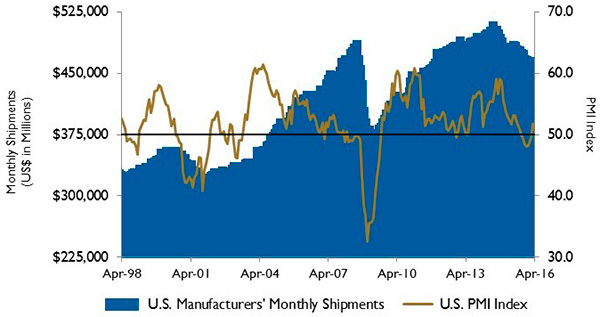
Figure 3. U.S. PMI and manufacturing shipments. Source: Institute for Supply Management Manufacturing Report on Business and U.S. Census Bureau

The largest gainers for the month included energy stocks, due to higher oil prices, while technology and health care stocks were the biggest laggards.

Reference
1. The S&P Return figures are provided by Capital IQ.

These materials were prepared for informational purposes from sources that are believed to be reliable but which could change without notice. Jordan, Knauff & Company and Pumps & Systems shall not in any way be liable for claims relating to these materials and makes no warranties, express or implied, or representations as to their accuracy or completeness or for errors or omissions contained herein. This information is not intended to be construed as tax, legal or investment advice. These materials do not constitute an offer to buy or sell any financial security or participate in any investment offering or deployment of capital.

Issue