
Lev Nelik explains calculations from the Moody diagram.
Pumping Machinery LLC, P&S Editorial Advisory Board
11/07/2018
Here are two questions on Part 1 of this article from the September issue of Pumps & Systems.
Reader No. 1
I understand that the article “A Step-by-Step Approach to Pump Selection” outlines a few basic pump system design steps. However, I thought that some of the analysis results might be reviewed so that Part 2 of the article continues with reasonable computation values. After choosing a 10-inch pipe, was the 5 feet per second (ft/s) velocity kept for a conservative calculation of the pipe friction head loss? The actual velocity for 1,000 gallons per minute (gpm) flowing in a 10-inch pipe would be closer to 4 ft/s. Otherwise, throttling the flow may be required. Even though the effect may not make a significant difference, shouldn’t the step 2 calculated Reynolds number exponent be 5 instead of 6? Using a roughness height value for cast iron, a friction factor smaller than 0.03 (i.e., 0.018) was obtained from the Moody diagram based on Reynolds number and relative roughness (ε/d). The 10-inch pipe roughness height that corresponds to the 0.03 factor is greater than that shown for old water mains. Was the 0.03 value also used for a very conservative pipe friction head loss calculation? Using the values shown in Equation 3, shouldn’t the calculated friction head loss be greater than 102 ft. (i.e., 148 ft.)? If so, the brake horsepower (bhp) calculation in Equation 4 is also affected. Any revisions can be reevaluated in step 4 of the “Pump Efficiency Calculator” program. Just before step 1, the system requirement is described as pumping cold water from a tank to a heat exchanger 2 miles away and then back to the tank. If the same pump also returns water to the tank, shouldn’t the total pipe length “L” in this circuit be 4 miles? If so, calculations in steps 2, 3 and 4 may need to be revised. Lee Ruiz Oceanside, California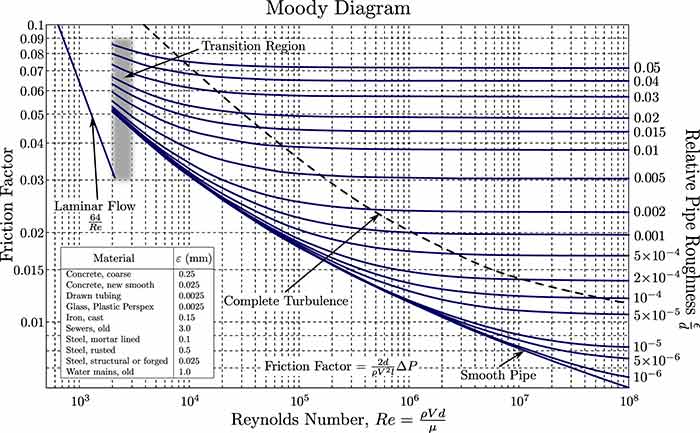 Image 1. Moody Diagram to determine friction losses (Image courtesy of the author)
Reader No. 2
I enjoyed your article. However, should the Figure 3 equation for h be 0.03 x 2 miles x (10/12) x V2 / 2 g = 102 ft.? Perhaps a refresher with Torricelli’s theorem of what V2 / 2g really gives you would give us novices a head start. Your importance in friction shows up great, but the Moody Diagram chart is difficult to read. As of late, my role with pumps, motors and their controls have been in the forefront. Variable frequency drives (VFDs) and energy savings top my list. I enjoy teaching my students how the formula was deprived with some simple math and real examples whenever possible. Your examples are perfect examples of just that. I think [the Equation 3 results are] 2 x 5,280 times (10/12 ratio) = 8,800. Then 8,800 ft. multiplied by 52 / 64.4 = 3,416, then times 0.03 = 102 ft. Or have I missed something? George Gianni G.G. DESIGN
My Response
Thank you, Lee and George; very observant and thorough comments. True, the process is indeed iterative, and I essentially only outlined the initial step. Once one has “looped-thru” it a few times, one can converge on the more precise answer. You are also correct regarding the return leg of the pipe. If the same pump is set to circulate the fluid all the way around, the additional friction losses need to be, of course, taken in consideration. George, you are exactly right, that is what the Equation 3 in the article comes out to. I also agree with your point that being able to break down complex things into simple (or at least simplified) explanations is a good way to teach and explain. George, if you track my article to check, it looks OK: 2 miles multiplied by 5,280 ft. gives you a total number (the result is in feet), and then 10 inches diameter gets converted to feet by 10/12 ratio—so that L/d ration comes out proper, which is then multiplied by the f-factor and times velocity head. The reason I used actual step-by-step calculations along with the Moody diagram is exactly the point you are making. Most folks get confused with the complexity of Moody graphics. They are not sure which line to look at, how to estimate “pipe roughness,” etc. I show the Moody chart so that folks at least see what it looks like, and then I follow calculations with explanations to get them a “sigh of relief.” The more enthusiastic readers, after that, should they want, can easily get the full size Moody (it is available on the internet) and study it at their leisure. Thank you for your comments—and keep on pumping!
To read more Pumping Prescriptions columns, click here.
