
In the event of seismic occurrences, structures and their components often resonate. Resonance occurs when the structure’s natural frequency coincides with the seismic activity’s frequency. For structures to be designed to withstand such occurrences, engineers perform an equivalent static analysis with forces proportional to the structure’s weight. Researchers eventually determined that the equivalent static analysis was only adequate for certain structures—mainly shorter structures with natural frequencies that have large separation margins from the seismic occurrence. Taller structures, such as long vertical service water pumps, have natural frequencies that coincide with frequencies present during seismic occurrences. Therefore, dynamic properties of the structure or system (mode shapes and natural frequencies) must be considered with the response spectrum of the structure, which then can be used to determine the resulting response in the event of a seismic occurrence. Reponses can include displacement, velocity, acceleration, force and moment.
Response Spectrum
Creating the plots in a response spectrum often includes subjecting an oscillating device with known spring, mass and damping to the transient loads. Personnel record the response over time and extract the maximum absolute amplitude. Next, they repeat the process through the frequency range using the same damping. Finally, the maximum responses are plotted over time as a function of frequency. Figure 1 is an example of an acceleration response versus frequency response spectra.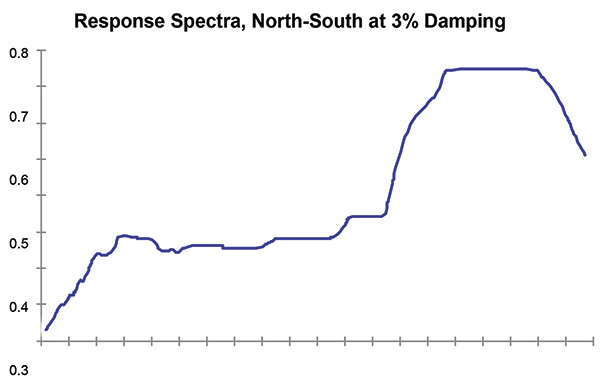 Figure 1. Acceleration vs. frequency (Graphics courtesy of Sulzer)
Response Extraction
A response spectrum can be combined with the system’s natural frequencies or mode shapes to determine the system’s response. Each mode shape of the structure has an inherent relative displacement, effective mass and participation factor. The participation factor combined with the response spectrum value will yield the mode coefficient. The mode coefficient will in turn yield the response of the mode shape. These combined responses from mode shapes will determine the total response of the system. To obtain an accurate solution of the entire system’s response, it is necessary to combine the responses of individual mode shapes such that their cumulative effective mass approaches 100 percent of the total mass. Computationally, this is intensive. The best practice is to capture at least the response up to 90 percent of the total mass. Combination methods for these responses include absolute summation, square root of sum of squares (SRSS) and complete quadratic combination (CQC). The absolute summation method is the most conservative, but is too conservative for many applications. The SRSS method is the most popular and works well with adequately separated frequencies. The CQC method is the most accurate and can account for closely spaced frequencies.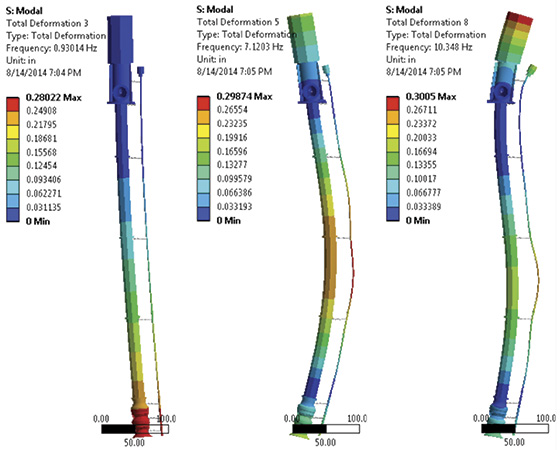 Figure 2 (left). Mode 1: 0.93014 Hertz (Hz). Figure 3 (center). Mode 2: 7.12033 Hz. Figure 4 (right). Mode 3: 10.348 Hz
Example
Imagine a 40-foot vertical turbine pump in a power plant weighing approximately 21,000 pounds. The owner wants to understand how much the pump’s suction bell will be displaced in the event of an earthquake. They have provided the acceleration versus frequency response spectra in Figure 1 (see page 110). To simplify the example, this article will consider only the first three mode shapes.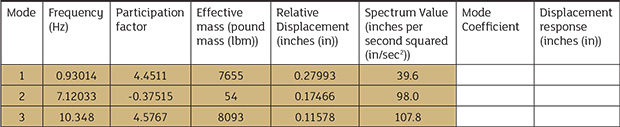 Table 1. Results from modal analysis
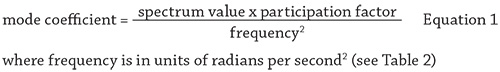
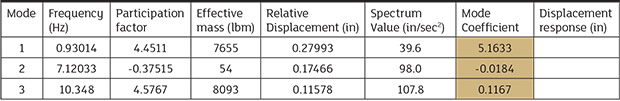 Table 2. Results from modal analysis including mode coefficients
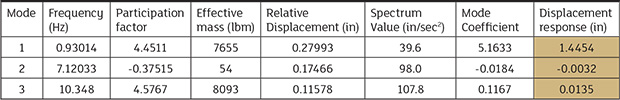 Table 3. Results from modal analysis including mode coefficients and displacement response