

This report is intended to take examine the fluid handling industry’s current performance. It is a compilation of the results and outlook of select industry companies based on their published results and comments.
Organic Orders, Revenue & More
Most public companies have temporarily withdrawn their guidance for 2020 with some companies expecting the ability to reestablish guidance with their second quarter (Q2) earnings reports.
The full impact of the COVID-19 crisis was not yet felt in the United States in Q1 but is expected to hit full force in Q2 along with the disruption in the oil and gas market. It is widely expected that Q2 will be the trough with industrial activity starting to rebound in Q3.
It seems that the supply chain in China has largely recovered and demand in China is increasing. Hopefully we will also see the supply chain sources in India quickly get back up to speed as well, so as demand returns worldwide companies will be able to meet that demand.
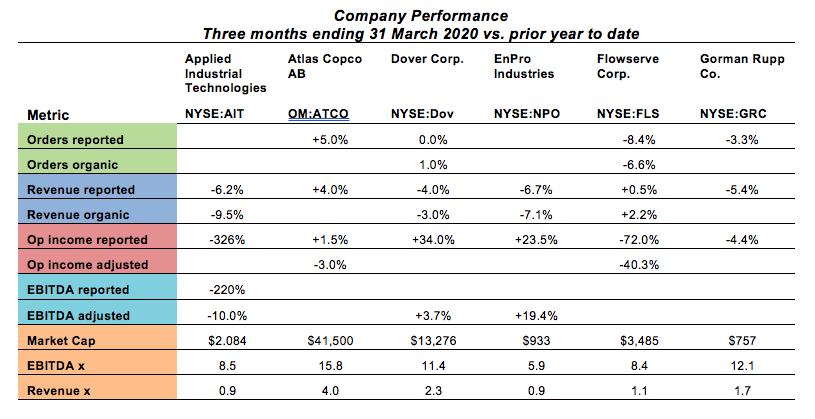
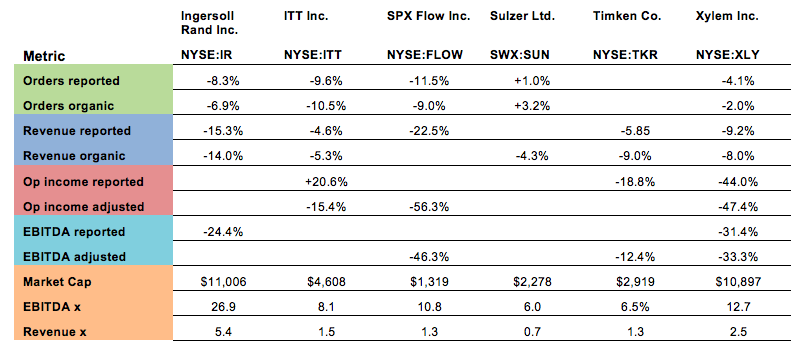
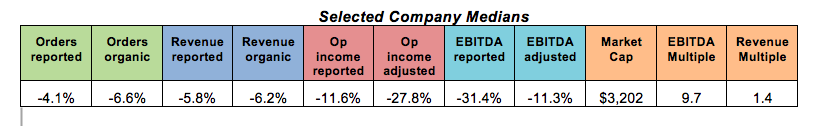
Of the 12 companies we sampled, seven reported on their level of organic orders, and of the seven, only two (Dover and Sulzer) reported positive organic orders for the quarter. The median decline in organic orders was 6.6 percent.
Nine companies reported on their level of organic revenue, and of the nine only one (Flowserve) reported positive organic revenue for the quarter. The median decline in organic revenue was 6.2 percent.
None of the companies reported positive growth in adjusted operating income and only two reported an increase in adjusted EBITDA (earnings before interest, taxes, depreciation and amortization). All of the profitability metric medians showed double-digit declines on single-digit revenue declines. However, in some cases the decline in reported operating performance includes noncash impairment charges, such as Applied Industrial Technologies which took a noncash goodwill impairment charge of $131 million on its recent acquisition of FCX.
With some of the write-downs already taken and with “right-sizing” actions being taken by many companies, perhaps the rate of decline in operating income versus revenue will decelerate to some extent in Q2. Then we should be able to expect the rate of margin improvement to accelerate at a faster rate versus revenue, once revenue starts to rebound in the second half.
The current median EBITDA valuation multiple of 9.7x for this group of companies compares the median multiple of 14.5x for this same group at the end of Q3 2019. This is a multiple contraction of 33 percent. The extent to which this multiple contraction is reversed going forward will largely depend on the degree to which investors’ confidence in long-term growth is restored and in what time frame that restoration occurs.
Definitions
We use the terms as defined by the companies in their reporting and presentations. Generally those definitions are consistent with the following: adjusted—reported metrics adjusted for one time or unusual items; EBITDA—earnings before interest, taxes, depreciation and amortization; EBITDA multiple—the factor applied to EBITDA to estimate the enterprise value (EV) of a business; EV—enterprise value is the combined amounts of market capitalization, minority interests, preferred stock and net debt; market cap—the total of price per share multiplied shares outstanding; organic—orders or revenue that does not include acquisitions made in the last 12 months nor the impact of changes in foreign currency; orders—orders booked in the period; revenue—revenue recognized in the period; reported—metrics provided per generally accepted accounting principals (GAAP); revenue—amount recorded as net sales for the period; revenue multiple—the factor applied to annual revenue to estimate the enterprise value of a business.
Note
Market cap values in millions USD; market data was collected in the period of May 15-19, 2020
Sources
Company presentations, SEC filings and Capital IQ.
