First of Two Parts
by Joe Evans

All pumps should be tested regularly, but wastewater pumps are at the top of the list because they are especially susceptible to changing system conditions. Even if a pump operates at its best efficiency point (BEP) at startup, many conditions will change during its lifetime of operation, including:

  • Malfunctioning gate and check valves
  • Partial blockages in the pipeline
  • Air accumulation at a high point
  • New branches entering a force main

Clear water systems can experience similar challenges, but the content of the pumpage makes wastewater systems more vulnerable. These changes can have a major effect on the pump’s operating point on its H/Q curve. Submersible wastewater pumps can be more challenging because they are out of sight and often out of mind.

Wastewater pumps can be problematic when operated at off-BEP conditions because of the size of their impellers. The large width that is required for solids passage increases the radial forces on higher-head pumps. This leads to increased shaft deflection, which will reduce seal, wear ring and bearing life. In addition to radial loading, operation to the left of BEP can lead to damaging suction and discharge recirculation cavitation.

To encourage frequent testing, I developed two simple submersible pump field test spreadsheets. One uses a flow meter for flow measurement and allows for the plotting of multiple test points. The spreadsheet that will be reviewed in this column uses a drawdown test to measure pump flow. Drawdown is still the most-used procedure for measuring flow in smaller and remote lift stations.

Figure 1 shows the pump test portion of the spreadsheet. The bottom right section is the drawdown test, and the bottom left section tests for total dynamic head (TDH). The gray cells are the entered data, and the yellow ones are the calculated data. The equations used for the calculations are shown to the right of the cells. The submersible motor testing portion of the spreadsheet will be featured in next month’s column.

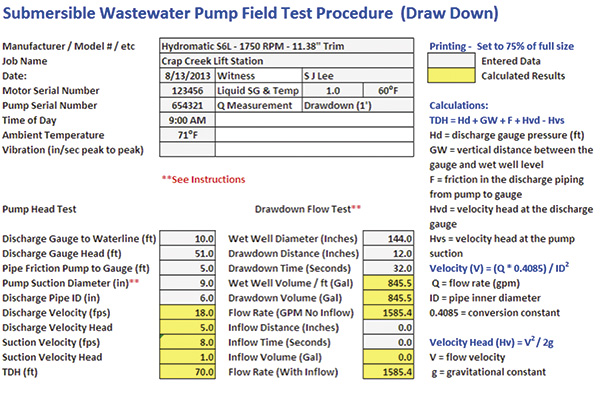
Figure 1. The pump test portion of the spreadsheet

Drawdown Analysis

We will begin with the drawdown analysis. Usually, a drawdown test measures the time required to remove one foot of water starting at the pump on level. The reason one foot is a preferred distance is that it provides for an ample time measurement, and flow changes little over a single foot. The distance can be measured with a laser device, a plumb bob, or a rod with starting and ending marks. It is best to shut off the invert once the pump start level is reached to obtain the greatest accuracy. If this cannot be accomplished, choose a time during the day when inflow is minimal. As seen in Figure 1, entering the wet well diameter, drawdown distance and drawdown time is the only data needed if the system has no inflow.

The spreadsheet calculations measure the wet volume per foot, the drawdown volume and the flow rate based on that information. In the example shown in Figure 1, the flow rate is 1,585 gallons per minute (gpm). If inflow occurred during the drawdown test, an inflow test can be performed immediately following drawdown. If the inflow is small, a 2- to 3-inch rise is all that is needed to calculate the inflow. If an inflow test is performed, the inflow volume is used for the final gallon-per-minute calculation. It is always best to perform two or three drawdown tests to obtain the most accurate results.

Total Dynamic Head Calculation

Pump head is measured with a high-quality pressure gauge at the pump start water level, immediately after pressure has stabilized. The TDH is calculated by taking into account the gauge to water level elevation, the pipe friction from the pump discharge to gauge location and the velocity head. Friction head loss is determined using a friction table. I considered calculating it but decided that a friction table for the proper piping material and fittings would provide a more accurate value. Discharge velocity head is calculated using the piping inside diameter at the gauge location, and the flow rate that is calculated during the drawdown test. As with the drawdown calculation, the equations used to calculate TDH are shown to the right of the calculator.

Notice that a cell for pump suction diameter and a calculation for suction velocity head are included. Some people believe that when a submersible pump incorporates an external “suction bell,” suction velocity head must be subtracted from the TDH calculation. If a user belongs to that group, he or she should enter the suction diameter in that cell. If the user does not believe this, he or she should enter a diameter large enough to reduce suction velocity head to zero.

In Figure 1, a 19-inch suction diameter provides for a zero velocity head at the suction. The discharge gauge reading was 51 feet, but when the calculator includes the gauge to water level elevation, friction in the piping and the discharge velocity head, the TDH is calculated at 71 feet. This pump tested at 1,585 gpm at 71 feet, which is approximately 97 percent of BEP flow. Wouldn’t it be nice if all pumps ran this close to their BEP?

In Part Two of this article, I review the submersible motor testing portion of the spreadsheet. These tests will provide more pump hydraulic test results based on motor performance and will also provide phase voltage and current unbalance calculations.

Issue