
Pumps & Systems, March 2007
Identifying the source of vibration by following the amplitude: the case of a company that thought the problem was a pump impeller, but, in fact, the problem was over 15-ft away and not a pump at all.
Many times we will bury ourselves in a problem looking at endless spectrums, waveforms, and machinery information in search of the source of a vibration problem, while forgetting the very basics of vibration.
Consider the following example at a large brewery. They had an unusual layout of three variable-speed pumps drawing water from a manifold system fed by two input pipes. When the production demand for water exceeded the capabilities of one pump, the second pump would be automatically started by a programmable logic control (PLC) system.
Accordingly, the two pumps would slow a bit until water demand again had both pumps running at near maximum capacity, when the third pump would kick in. Again, all three pumps would slow down to match demand. A major problem appeared when the second pump kicked in and the speed slowed. As the two pumps sped up, the vibration seemed to disappear. When the third pump kicked in and all three pumps again slowed down, the vibration was approaching 0.6-in/sec RMS.
The company had contracted a vibration company to analyze the problem. The company collected a number of spectrums, which all indicated the source of the vibration was four times the running speed. After further investigation, they discovered that the pump had four impellers. They had their analysis and proclaimed in their report that the source of the problem was the impeller in Pump #2.
The brewery disassembled the pump and inspected the blades and housing. Everything appeared fine and in specification. After reassembly they still had the same vibration problem.
Another company was asked to come on site to provide a presentation for an on-line vibration system. Before the meeting began, they were asked to look at the problem pump. At that moment, they had nothing more than a small pocket vibration meter that measured overall vibration and had no spectrum capability.
As the brewery placed the pumps into the operating configuration which gave them the most vibration, the company began to take various readings with their overall vibration meter. They noticed that taking measurements on the Pump #2 intake produced higher values than near the pump bearings. Pump #1 and #3 also exhibited vibration very near the level of Pump #2.
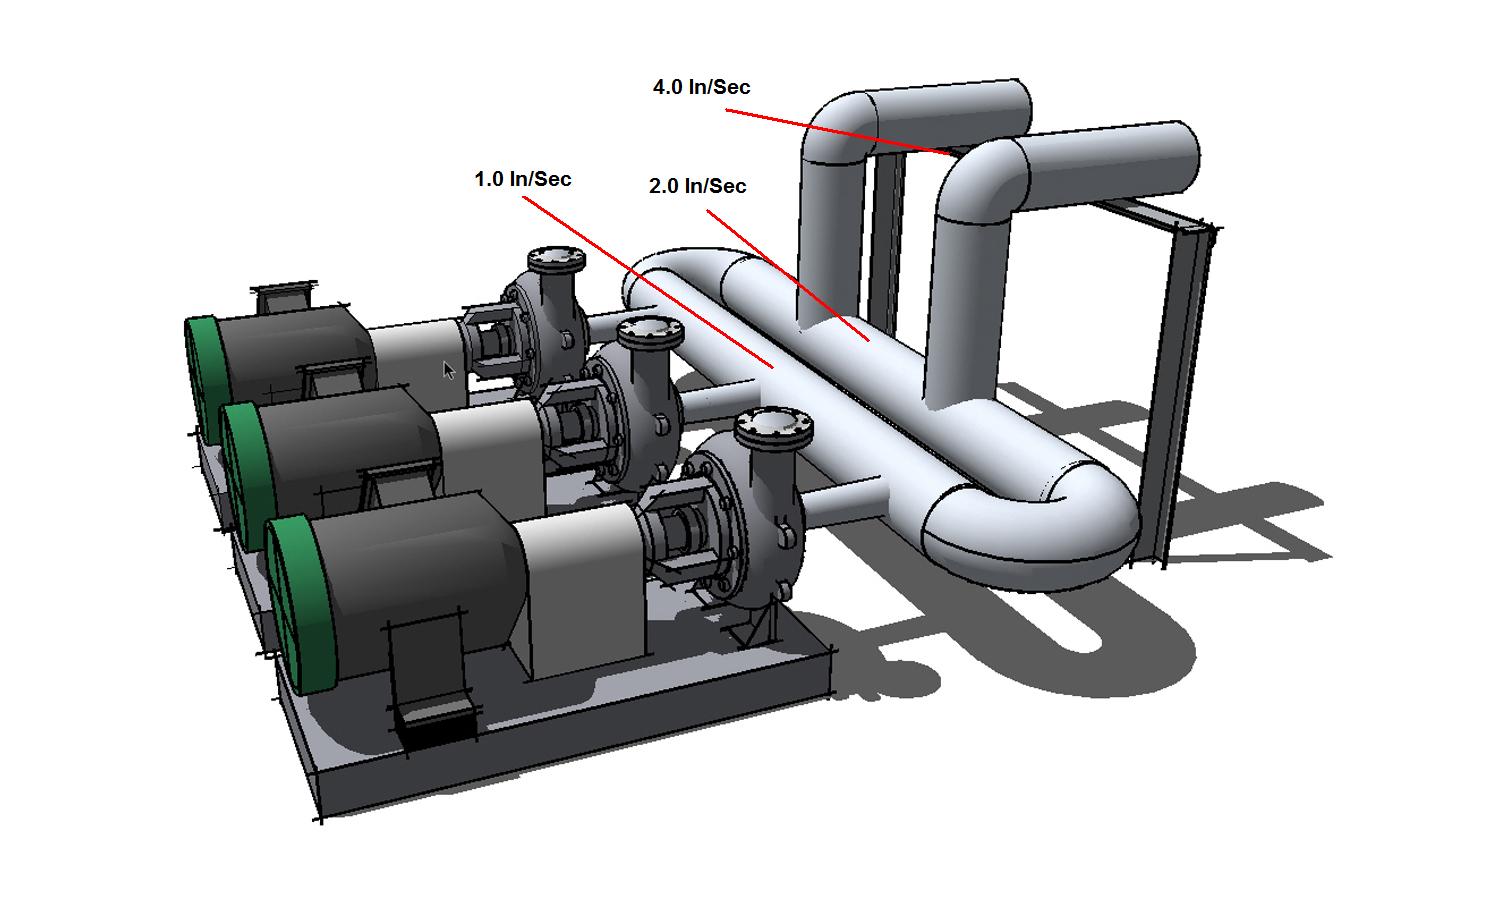
They shifted their attention to the intake manifold and found the readings at 1-in/sec. They moved to the two input feeds and again the vibration was worse, now up to 1.5-in/sec. As they followed the vibration, they found the highest amplitude to be 4-in/sec on a support beam that held the intake pipes (see Figure 1).
They proceeded to take measurements every 4-in along the support structure and plotted the results on graph paper (see Figure 2).
.jpg)
They discovered that the support beam was resonating at the vane frequency during the lowest running speed of the pumps. The beating shock wave created by the pump impellers was feeding back through the intake pipe system and exciting the support beam into resonance. A diagonal support was welded in to stiffen the structure and shift the resonance up (see Figure 3).
.jpg)
Thereafter, the vibration almost totally disappeared. Readings were below 0.1-in/sec at the support beam and 0.07-in/sec at the pumps. The brewery was very pleased that the solution to the problem turned out to be so simple. In this case, the vibration system company simply followed the most basic rule of vibration: "Follow the amplitude."
