
In the last three columns ("Troubleshooting Piping Systems" in the September, October and November 2015 issues of Pumps & Systems, read them here), we examined how a physical piping system can be mathematically simulated using basic engineering equations described in hydraulic textbooks, technical standards and manufacturer test data. Because all the calculations are based on well-understood equations, one can determine the pressure and flow rate in the system using the simulation. We also worked through an example system to calculate the head at various locations within the system and validate the simulation to the physical piping system using installed plant instrumentation. In the example, all calculated results closely matched the values on the installed plant instruments This series will evaluate piping systems for which the calculated results do not match the displayed plant instrumentation. The difference between the calculated values and the observed values will allow us to troubleshoot the example system. This month's column in particular will focus on the components of the pump and drive. The objective is not to show all the possible problems that can occur in a system; instead, it is to understand the connections of the various components of the system and how to use that information to identify system problems.
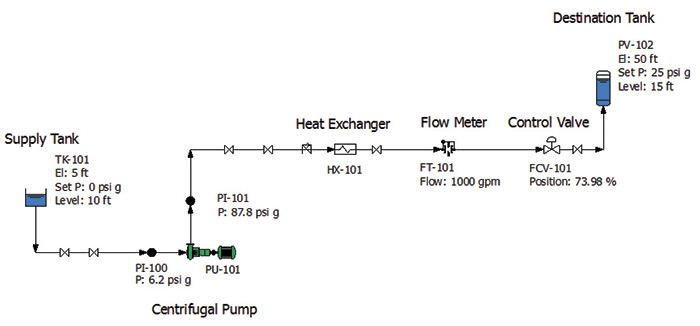 Figure 1. Normal operating conditions for the example fluid piping system as calculated on the piping system model (Graphics courtesy of the author)
Pump Elements
To begin, it is important to review conditions associated with the pump elements that can affect the system. As discussed in previous columns, centrifugal pumps always operate on a pump curve. A pump is designed to meet a specific range of flow rates and head values, and this information is documented on the manufacturer's supplied pump curve. Figure 2 is the manufacturer's supplied catalog curve for the pump used in our example system that was tested according to Hydraulic Institute industry standards. The manufacturer makes this pump available with impeller diameters ranging from 13 to 16.75 inches. This approach allows the manufacturer to design a pump casing and impeller that can operate under a range of head and flow values by changing the impeller diameter. The actual impeller diameter supplied by the manufacturer for this pump is 14.125 inches and is shown as a dark line in Figure 2.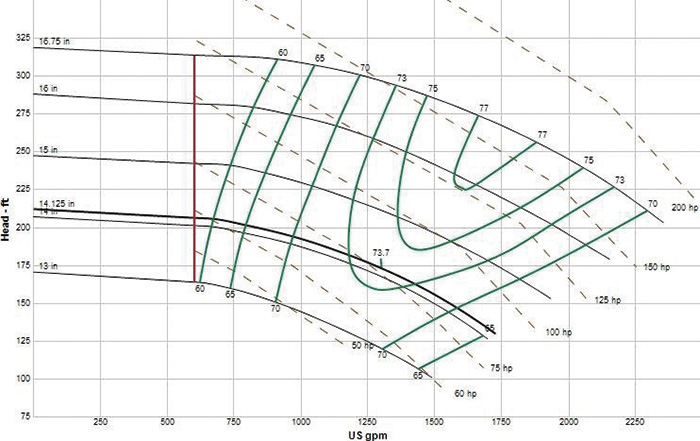 Figure 2. Manufacturer's catalog pump curve for the installed centrifugal pump PU-101, which is a 6x4-17 end suction pump operating at 1,780 revolutions per minute (rpm). The installed pump was supplied with a 14.125-inch impeller by the manufacturer to meet the original design point.
High Discharge Pressure
In this example, an operator making his rounds notices pressure gauge PI-101 is reading 104 pounds per square inch (psi), which appears to be above normal. The plant engineer must evaluate the system and determine why the pump has a high discharge pressure. The piping system displayed in Figure 1 was validated more than a year ago. A comparison of the two sets of values shows that the pressure at PI-101 is approximately 16 psi greater than expected from the piping system model. With this information, we must determine first if there is a problem in our system and, if so, what is causing it. In cases like this, it is a good idea to contact the operator who reported the discrepancy to see if the individual can provide further details. A good plant operator can offer a wealth of information and may be able to provide valuable insight based on years of experience. The operator in this example has extensive plant experience and said that it has been more than six months since the individual was assigned to this area of the plant. The operator recalled pump discharge pressures at PI-101 between 85 and 95 psi based on normal plant operation. The individual also recalled that PI-100 pump's suction pressure ranged from 4 to 8.3 psi. This indicates that the pump discharge pressure of 104 psi is outside the range of expected operation. After reviewing the current operating conditions and comparing them with the validated results, we can see that something has changed in the system. The next step is to determine what happened and why. Table 1 is a comparison of the current as-observed operating data and the validated piping system model from a year ago. The data in Table 1 shows the flow rate through the system in both conditions was controlled to 1,000 gallons per minute (gpm). The only differences in the observed data are the pump's discharge pressure and the position of control valve FCV-101. Because all items in a system are interconnected, the observed condition could be caused by any piece of equipment. The validated piping system model will help us isolate the possible causes. My personal preference is to first identify each circuit in the system and then work from the boundaries of each circuit to identify the potential problem. The fact that our example system consists of only a single circuit simplifies the process. Table 1 indicates the level in supply tank TK-101 is 10 feet in the current observed operation and the validated system model. The level and pressure in the destination tank PV-102 is the same under both conditions. Based on this, we can eliminate changes in the static head between the current system and the validated system model for the increased pump discharge pressure.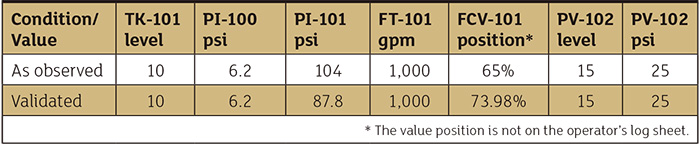 Table 1. Comparison of observed plant instrumentation with the validated piping system model